
Oil product imports fell N2,917.96 billion in the second quarter, more than the N2,069.66 billion fall in all of Nigeria's imports
The statistics bureau's trade report for April to June 2026 says imports fell 12.55 per cent and the trade surplus doubled. Its own figures show the fall in imports came entirely from oil products, which dropped from N3,993.07 billion to N1,075.11 billion. Every other import rose by N848.30 billion, and net trade in oil products accounts for 87.63 per cent of the wider surplus.

The National Bureau of Statistics has published its Foreign Trade in Goods Statistics report for the second quarter of 2026. Its headline is that the trade surplus widened. Page 7 puts total imports for April to June at N14,424.01 billion, 12.55 per cent below the N16,493.67 billion of the same quarter of 2025, and the merchandise trade balance at a surplus of N12,596.86 billion, which the Bureau describes as a 101.32 per cent increase on a year earlier.
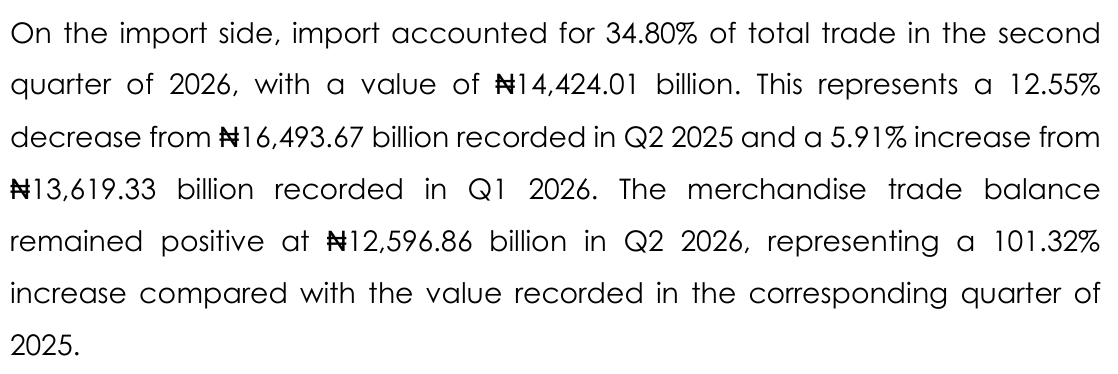
One line on page 3 accounts for more than the whole of that fall in imports. The Bureau reports that "the value of other oil products imported in Q2 2026 stood at N1,075.11 billion, reflecting a 73.08% decrease from N3,993.07 billion in Q2 2025". The difference is N3,993.07 billion minus N1,075.11 billion, or N2,917.96 billion. Total imports fell by N16,493.67 billion minus N14,424.01 billion, or N2,069.66 billion.

Because the fall in oil product imports is larger than the fall in all imports, everything else Nigeria bought abroad rose. Imports other than oil products came to N16,493.67 billion minus N3,993.07 billion, or N12,500.60 billion, in the second quarter of 2025, and N14,424.01 billion minus N1,075.11 billion, or N13,348.90 billion, in the second quarter of 2026. That is an increase of N848.30 billion, or 6.79 per cent. The same page shows where much of it went: imported manufactured goods rose 20.65 per cent, from N7,883.33 billion to N9,511.36 billion.
Oil products also fell as a share of the import bill. They were 24.21 per cent of imports in the second quarter of 2025 (N3,993.07 billion of N16,493.67 billion) and 7.45 per cent in the second quarter of 2026, the share the Bureau's Table 10 gives for "Other Petroleum Oil products". The fall was not steady through the year: page 3 also records that oil product imports were N748.10 billion in the first quarter of 2026, so the second quarter was 43.71 per cent higher than the first.
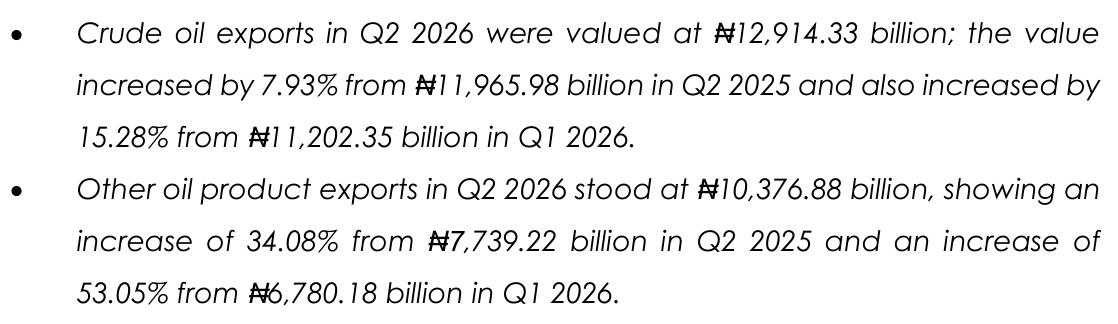
On the export side, page 4 reports that other oil product exports reached N10,376.88 billion, up 34.08 per cent from N7,739.22 billion a year earlier, while crude oil exports were N12,914.33 billion, up 7.93 per cent from N11,965.98 billion. Crude oil remained the largest single export at 47.79 per cent of the N27,020.88 billion total, according to page 6.
Taken together, the oil product lines explain most of the wider surplus. The second quarter 2025 balance, from the Bureau's own totals, was N22,750.74 billion minus N16,493.67 billion, or N6,257.07 billion. The 2026 balance is higher by N12,596.86 billion minus N6,257.07 billion, or N6,339.79 billion, and N12,596.86 billion over N6,257.07 billion gives the 101.32 per cent rise the Bureau reports. Net trade in other oil products moved from N7,739.22 billion minus N3,993.07 billion, a surplus of N3,746.15 billion, to N10,376.88 billion minus N1,075.11 billion, a surplus of N9,301.77 billion. That swing of N5,555.62 billion is 87.63 per cent of the increase in the overall surplus.
The category is broader than refined fuel. The product ranking in the Bureau's accompanying tables lists natural gas exports of N2,819.59 billion and other petroleum gases of N1,888.59 billion among the leading exports, alongside kerosene type jet fuel at N2,935.07 billion, gas oil at N1,322.41 billion and motor spirit at N546.02 billion. These sit in the oil product group, so the export rise is not a measure of refined fuel alone.
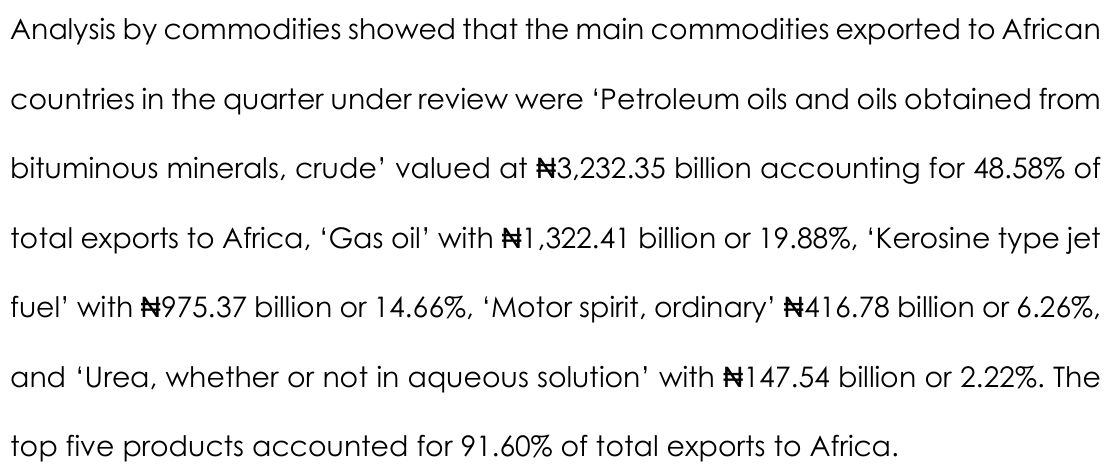
Refined fuels went largely to African buyers. Page 13 lists the main exports to African countries as crude oil worth N3,232.35 billion, gas oil worth N1,322.41 billion, kerosene type jet fuel worth N975.37 billion and motor spirit worth N416.78 billion. The gas oil figure is the same as the gas oil total in the product ranking, so on the Bureau's figures all of the quarter's diesel exports went to Africa. The three refined fuels together come to N1,322.41 billion plus N975.37 billion plus N416.78 billion, or N2,714.56 billion.
Petrol still flows both ways. Page 3 names motor spirit as the most imported commodity of the quarter, and the product ranking puts its import value at N952.15 billion, 6.60 per cent of all imports. The same table records N546.02 billion of motor spirit exported, so by value Nigeria imported N406.13 billion more petrol than it exported in the quarter.
The record supports the Bureau's headline. Its component figures re-add: exports of N27,020.88 billion and imports of N14,424.01 billion make the N41,444.89 billion total trade on page 6, and the difference is N12,596.87 billion, one hundredth off the published balance through rounding. The monthly balances in Table 8, N4,887.18 billion, N3,412.55 billion and N4,297.13 billion, add to N12,596.86 billion. The sector bullets on page 4 omit energy goods of N81.35 billion, which Table 10 includes; with it, the non-oil sectors add to the N3,729.67 billion non-oil export figure the report gives on page 6, give or take rounding.
The report records values in naira only. It does not give volumes or dollar values, so it cannot show how much of the change reflects quantities of fuel rather than prices or the exchange rate. It does not name the refineries, traders or companies behind any import or export, and it does not explain the rise in oil product imports between the first and second quarters.
What this rests on
NBS, Foreign Trade in Goods Statistics Q2 2026 (report, September 2026) pp.3, 4, 6, 7, 13, and the accompanying tables workbook (Tables 8 and 10, Product Ranking). Arithmetic: 3,993.07 - 1,075.11 = 2,917.96; 16,493.67 - 14,424.01 = 2,069.66; non oil product imports 16,493.67 - 3,993.07 = 12,500.60 and 14,424.01 - 1,075.11 = 13,348.90, difference 848.30 (6.79%); shares 3,993.07/16,493.67 = 24.21%, 1,075.11/14,424.01 = 7.45%; Q2 2025 balance 22,750.74 - 16,493.67 = 6,257.07; rise 12,596.86 - 6,257.07 = 6,339.79; 12,596.86/6,257.07 = 2.0132 (101.32%); oil product net 7,739.22 - 3,993.07 = 3,746.15 and 10,376.88 - 1,075.11 = 9,301.77, swing 5,555.62 = 87.63% of 6,339.79; Africa fuels 1,322.41 + 975.37 + 416.78 = 2,714.56; petrol 952.15 - 546.02 = 406.13; total trade 27,020.88 + 14,424.01 = 41,444.89; monthly balances 4,887.18 + 3,412.55 + 4,297.13 = 12,596.86; non oil sectors 802.99 + 2,305.40 + 146.91 + 81.35 + 393.03 = 3,729.68 (3,729.67 published, rounding).
What this does not establish
Volumes and dollar values; how much of the change is price or exchange rate rather than quantity; which refineries, traders or companies account for any flow; why oil product imports rose 43.71% from Q1 to Q2 2026; whether the figures will be revised.
What we did ourselves
Downloaded and read the NBS report and workbook; re-added the import, export, balance and sector figures; derived the change in non oil product imports and the oil product share of the change in the surplus.
Sources for this report
(A) National Bureau of Statistics, Foreign Trade in Goods Statistics (Q2 2026), report and tables workbook, September 2026
- Foreign Trade in Goods Statistics (Q2 2026) · National Bureau of Statistics · 2026-09
- Q2 2026 Foreign Trade in Goods Statistics Tables (xlsx) · National Bureau of Statistics · 2026-09
Confidence: high. This is our own assessment of whether the event occurred as described, separate from the grade, which describes what kind of thing the claim rests on.
Not obtained: where the underlying document is named above but not linked, we did not hold a copy at the time of publication. We purchase nothing and request nothing in our own name.
Corrections
None on this report. If you find an error, it will be published here, at the same length, with the date it was found, and the original wording will remain visible above it.

Dr VeroInvestigations editor, Vero Record
Reads the Nigerian public record that others leave unread: budgets, audit reports, court files and registers. Every claim on this page carries the grade of the document behind it, and the report says what that document does not establish.
All 97 reportsHow we grade evidenceAdd Vero Record as a preferred source on Google