
NERC's second-quarter report raises its first-quarter meter count by 69,490, and the missing meters surface in the June totals for Ibadan and Kano
The electricity regulator's report for April to June 2026 says meter installations fell 17.97 per cent, to 350,270. That fall is measured against a first-quarter figure the Commission has revised from 357,495 to 426,985, entirely through new submissions from Ibadan and Kano. Against the figure it first published, installations fell 2.02 per cent. The 69,490 extra meters were not added back to the 31 March totals; they appear in the 30 June count of metered customers instead.
The Nigerian Electricity Regulatory Commission has published its quarterly report for April to June 2026, the document it prepares under Section 56(3) of the Electricity Act 2023 for the President and the National Assembly. On metering, it reports that 350,270 meters were installed in the second quarter, 17.97 per cent fewer than the 426,985 it now gives for the first quarter. The Commission's own first-quarter report, published in July, had put that quarter's installations at 357,495. Footnote 29 on page 56 of the new report records the change: "Following data reconciliation arising from updated submissions by DisCos, the number of customers metered in 2026/Q1 was revised from 357,495 reported in the 2026/Q1 report to 426,985." The difference is 69,490 meters, which is 19.44 per cent more than the figure first published.
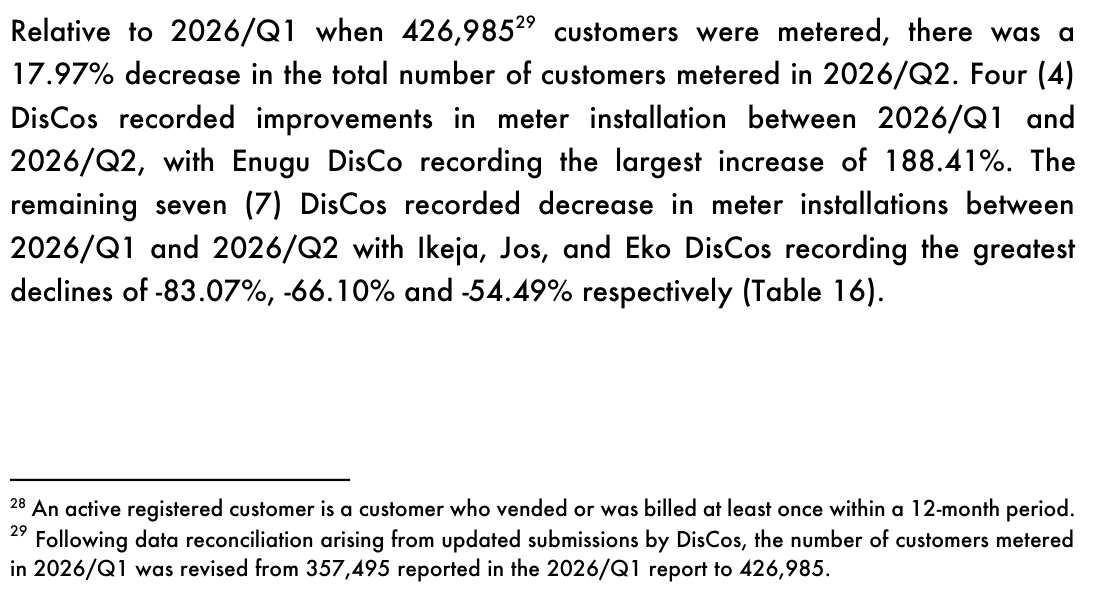
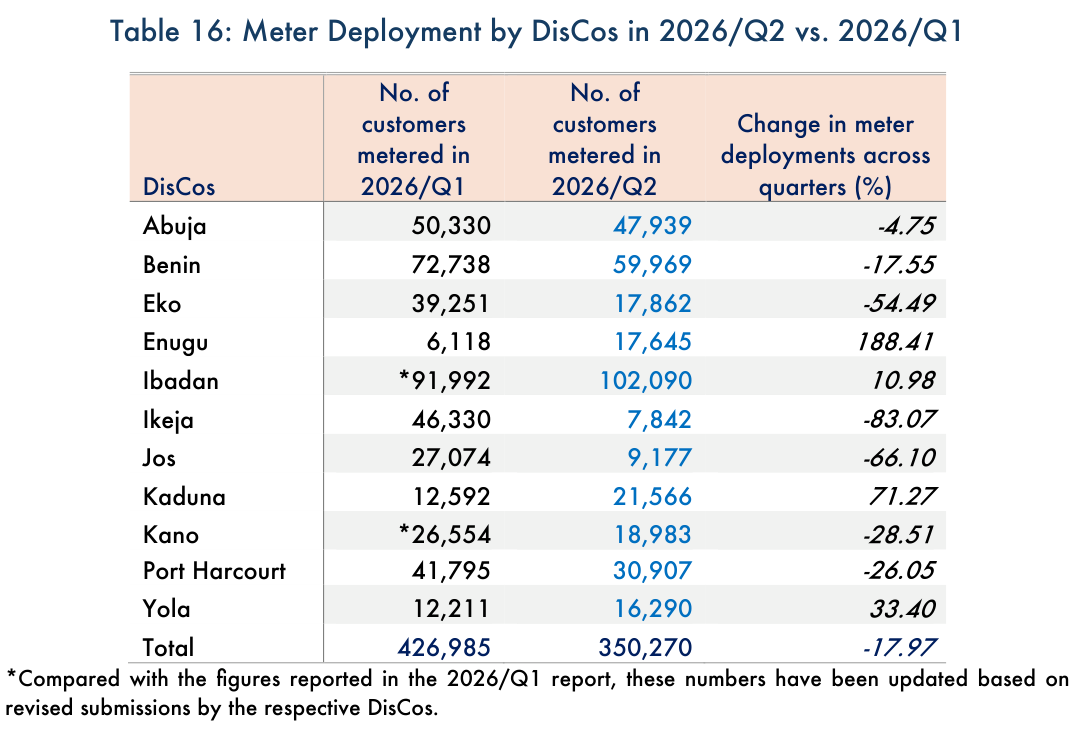
Table 16 on page 57 shows where the revision sits. Two distribution companies carry an asterisk. Ibadan's first-quarter installations rise from 48,619 to 91,992, an addition of 43,373, and Kano's rise from 437 to 26,554, an addition of 26,117. Together that is 43,373 + 26,117 = 69,490, the whole of the revision; the figures for the other nine DisCos are unchanged. The framework appendices in the two reports show what kind of meters were added: first-quarter installations under the Meter Acquisition Fund rise from 97,992 to 122,583 (Ibadan 17,634 and Kano 6,957, where the July report showed none), those under the Distribution Sector Recovery Program rise from 129,224 to 173,995, and those under the Meter Asset Provider framework rise from 118,681 to 118,809, the 128 extra all in Kano. The three changes, 24,591 + 44,771 + 128, again add to 69,490.
The revision changes the comparisons both reports draw. The July report said first-quarter installations were 10.38 per cent higher than the 323,864 of the last quarter of 2025, and that Kano's installations had fallen by 94.81 per cent, from 8,419 to 437. On the revised count, the first quarter was 31.84 per cent above the last quarter of 2025, and Kano's 26,554 was 215.41 per cent above its 8,419. In the other direction, the second quarter's 17.97 per cent fall is measured against the larger, revised base. Set against the 357,495 that was first published, the second quarter's 350,270 is 7,225 lower, a fall of 2.02 per cent. On the revised figures, installations for the first half of 2026 come to 426,985 + 350,270 = 777,255; a half-year total of 707,765 that has appeared in coverage of the report is the sum of the original first-quarter figure and the second-quarter figure.
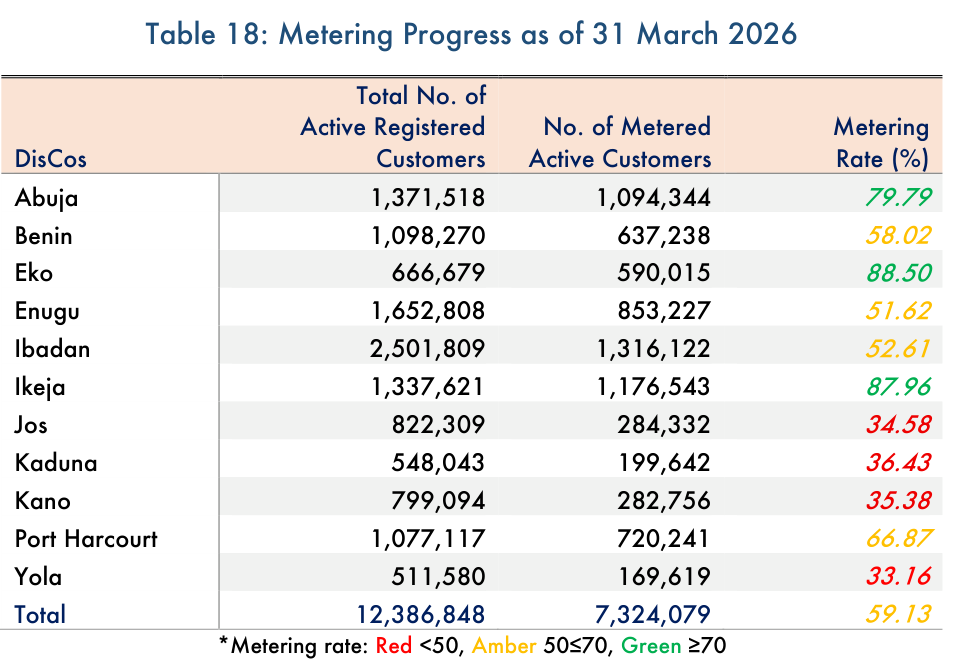
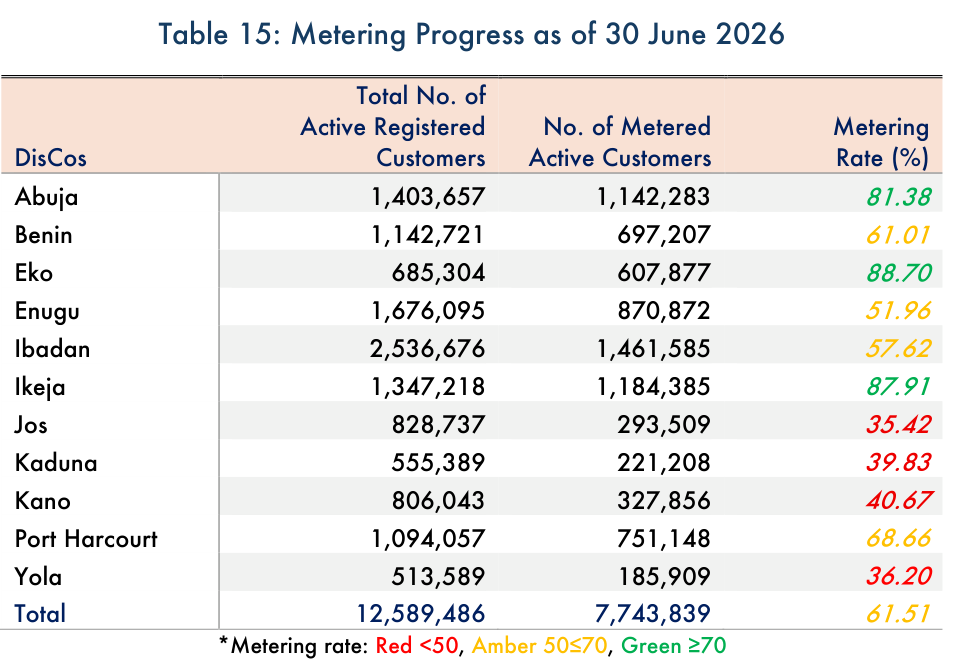
The revision also explains a gap between the two reports' totals of metered customers. Table 18 of the first-quarter report counts 7,324,079 metered active customers out of 12,386,848 on 31 March 2026, a metering rate of 59.13 per cent. Table 15 of the new report counts 7,743,839 out of 12,589,486 on 30 June 2026, a rate of 61.51 per cent. The metered total rose by 7,743,839 - 7,324,079 = 419,760 in a quarter in which, by the Commission's own count, 350,270 meters were installed. The difference, 69,490, is the size of the first-quarter revision.
DisCo by DisCo, the pattern is exact. For nine DisCos the metered total rose by precisely the number of meters installed in the quarter: Eko went from 590,015 to 607,877, a rise of 17,862, equal to its 17,862 installations, and Abuja went from 1,094,344 to 1,142,283, a rise of 47,939, equal to its 47,939. Ibadan's metered total rose from 1,316,122 to 1,461,585, a rise of 145,463, against 102,090 installations; the excess is 43,373, the Ibadan revision. Kano's rose from 282,756 to 327,856, a rise of 45,100, against 18,983 installations; the excess is 26,117, the Kano revision. The Commission did not restate the 31 March totals. The meters missing from the July report entered the count in the 30 June figures instead.
Had the 69,490 meters been included on 31 March, the metered total that day would have been 7,393,569 and the metering rate 59.69 per cent, not 59.13 per cent. On that like-for-like basis, the rate rose by 1.82 percentage points over the second quarter, not by the 2.38 points that separate the two published rates. The first-quarter report also gives its 31 March total in two forms: 7,324,079 in Table 18 and 7,324,097 in its summary.
The per-DisCo figures that have been circulating as a fall in metered customers, among them Eko from 39,251 to 17,862, Benin from 72,738 to 59,969 and Abuja from 50,330 to 47,939, are the two columns of Table 16. Their headings read "No. of customers metered in" each quarter, and the report's text describes them as meter installations. They count meters installed during each quarter, not the number of customers with meters. No DisCo's metered total fell between March and June: Eko's rose to 607,877, a metering rate of 88.70 per cent, Benin's to 697,207 and Abuja's to 1,142,283. What fell was the pace of installation in seven DisCos, most sharply at Ikeja (46,330 to 7,842, down 83.07 per cent), Jos (27,074 to 9,177, down 66.10 per cent) and Eko (down 54.49 per cent).
Most of the meters are paid for through public programmes. The Distribution Sector Recovery Program, which the report describes as a Federal Government initiative supported by a $500 million World Bank loan, aims to deploy 3.2 million smart meters. Appendix XIII on page 80 counts 110,469 meters installed from May to December 2025, 173,995 in the first quarter of 2026 and 205,486 in the second, which add to 489,950, the cumulative figure the report gives. That is 15.31 per cent of the 3.2 million target, fourteen months after installations began. The programme supplied 205,486 of the second quarter's 350,270 meters, or 58.67 per cent. The report puts the second quarter's programme installations 18.10 per cent above the revised first-quarter figure of 173,995; against the 129,224 first published in July, the increase would have been 59.02 per cent.
The Meter Acquisition Fund is paid for by electricity customers. The Commission created it in February 2023 as a metering surcharge in the allowed tariffs of all DisCos, and its Order NERC/2025/107, effective on 6 October 2025, let DisCos use N28.00 billion of the accrued funds to meter Band A and Band B customers. After the revision, Appendix X on page 77 shows 122,583 meters installed under the Fund in the first quarter and 13,028 in the second, a fall of 109,555, or 89.37 per cent. Benin went from 13,786 to 64, Port Harcourt from 11,070 to 17, Ikeja from 31,507 to 5,736 and Eko from 18,598 to 1,126. The report gives no reason for the fall. Its cumulative total since the start of 2025, 32,593 + 61,654 + 10,467 + 22,748 + 122,583 + 13,028 = 263,073, matches the figure it prints.
The first quarter is not the only figure that differs between the two reports. Appendix IX of each report counts meters installed under all frameworks since 2019. For the years 2019 to 2025, the new report's figures differ from the sum of the same DisCo's columns in the July report: Enugu's rises from 528,553 to 561,881 (up 33,328), Ibadan's falls from 736,368 to 711,076 (down 25,292) and Jos's falls from 196,552 to 184,719 (down 11,833). Across all eleven DisCos the total moves from 4,202,914 to 4,195,201, down 7,713. None of these changes is marked. Within the July report's Appendix IX, the Total row gives 3,256,555 meters for 2019 to 2024, while the eleven DisCo rows add to 3,222,910, a difference of 33,645. The new report's Appendix IX adds up: 4,195,201 + 426,985 + 350,270 = 4,972,456 meters since 2019, the total it prints.
The count matters for money because the same report sets out what weak metering costs. In the second quarter the Federal Government incurred a tariff subsidy obligation of N321.26 billion (April N108.40 billion, May N112.93 billion and June N99.93 billion, which add to N321.26 billion), which the Nigerian Bulk Electricity Trading company invoices to the Federal Ministry of Finance. The DisCos received electricity worth N946.57 billion and billed customers N744.67 billion, a billing loss of N201.90 billion. The Commission writes that "The most proven methods to improve energy accounting and revenue recovery are accurate customer enumeration and the installation of end-use customer meters." Meter counts are how that progress is measured, and in this report the first-quarter count changed by 69,490 after publication.
The report does not say why the Ibadan and Kano submissions changed, or whether the added meters were verified in the field. It does not explain how replacement meters are treated: in every DisCo the metered total grows by exactly the number of meters installed, which would hold only if meters that replace an existing one are either left out of the installation count or counted as newly metered customers. Nor does it explain the unmarked changes to the 2019 to 2025 figures, or the fall in installations under the Meter Acquisition Fund. The Commission was not asked for comment before publication; the figures above are its own, set against each other.
What this rests on
Two reports of the Nigerian Electricity Regulatory Commission, both downloaded on 3 October 2026 from nerc.gov.ng and read for this report: the Second Quarter 2026 NERC Quarterly Report (93 pages, file 2026_Q2_Report.pdf, created 24 September 2026) and the First Quarter 2026 report (94 pages, 2026_Q1-Report.pdf, created 1 July 2026). The metering figures come from Tables 15 and 16 and footnote 29 (printed pages 56 to 57) and Appendices IX, X and XIII (pages 76, 77 and 80) of the second-quarter report, and from Tables 18 and 19 (pages 58 to 59), the summary and Appendices IX to XI of the first-quarter report. The subsidy and billing figures come from section 2.3 and Table 9 of the second-quarter report. Arithmetic re-done: 426,985 - 357,495 = 69,490 (19.44 per cent); Ibadan 91,992 - 48,619 = 43,373 and Kano 26,554 - 437 = 26,117, which add to 69,490; framework changes 24,591 + 44,771 + 128 = 69,490; 7,743,839 - 7,324,079 = 419,760 = 350,270 + 69,490; change in metered total against installations for all eleven DisCos (nine match exactly, Ibadan and Kano differ by exactly their revisions); restated 31 March rate 7,393,569 / 12,386,848 = 59.69 per cent; 350,270 against 357,495 = -2.02 per cent; 426,985 / 323,864 = +31.84 per cent; Kano 26,554 / 8,419 = +215.41 per cent; DISREP 110,469 + 173,995 + 205,486 = 489,950 and 489,950 / 3,200,000 = 15.31 per cent; 205,486 / 129,224 = +59.02 per cent; MAF 122,583 to 13,028 = -89.37 per cent, and the six quarterly MAF figures add to 263,073; Appendix IX 4,195,201 + 426,985 + 350,270 = 4,972,456; July Appendix IX DisCo rows for 2019 to 2024 add to 3,222,910 against a printed total of 3,256,555; subsidy N108.40bn + N112.93bn + N99.93bn = N321.26bn, and N647.72bn - N326.46bn = N321.26bn; billing loss N946.57bn - N744.67bn = N201.90bn.
What this does not establish
Whether the revised first-quarter counts for Ibadan and Kano are accurate, why the DisCos' original submissions were lower, or whether any of the meters were checked in the field; the report says only that the revision followed data reconciliation arising from updated submissions by DisCos. Nothing in the documents suggests wrongdoing by anyone, and none is alleged. How replacement meters are treated in the installation and metered-customer counts. Why the 2019 to 2025 figures by DisCo changed between the two reports, and which of the July report's Appendix IX figures, the DisCo rows or the printed total, is correct. Why installations under the Meter Acquisition Fund fell in the second quarter, and how much of the N28.00 billion Tranche B allowance has been spent. How much of the N321.26 billion subsidy obligation the Federal Government has actually paid; the report records the obligation, not the payment. The Commission was not asked for comment.
What we did ourselves
Downloaded both quarterly reports from the Commission's website and set the second-quarter metering tables against the first-quarter ones, DisCo by DisCo. Traced the 69,490-meter revision to Ibadan and Kano and to the three metering frameworks. Reconciled the change in each DisCo's metered-customer total against its second-quarter installations, which showed that the revised meters were booked in the 30 June totals rather than restated at 31 March. Recomputed the quarter-on-quarter comparisons against both the original and the revised figures, the restated 31 March metering rate, and the cumulative programme totals. Compared Appendix IX across the two reports and re-added the July report's columns, which showed unmarked changes to the 2019 to 2025 figures and a printed total that does not match its rows.
Sources for this report
(A) Nigerian Electricity Regulatory Commission, Second Quarter 2026 NERC Quarterly Reports (April to June 2026), section 4.2, Tables 15 and 16, footnote 29, Appendices IX, X and XIII; and First Quarter 2026 NERC Quarterly Reports, section 4.2, Tables 18 and 19, Appendices IX to XI.
- Second Quarter 2026 NERC Quarterly Reports (93 pages) · Nigerian Electricity Regulatory Commission · September 2026
- First Quarter 2026 NERC Quarterly Reports (94 pages) · Nigerian Electricity Regulatory Commission · July 2026
- NERC Second Quarter 2026 Report (publication page) · Nigerian Electricity Regulatory Commission · September 2026
- FG installs 707,765 meters in Q2, 4.8 million electricity customers remain unmetered · Nairametrics · 2 October 2026
- Metering Rate Hits 61.51% As DisCos Record 203,521 New Installations In June, NERC · Leadership · October 2026
- NERC: Electricity subsidy gulped N679bn in H1 2026, down by 35% · TheCable · September 2026
Confidence: high. This is our own assessment of whether the event occurred as described, separate from the grade, which describes what kind of thing the claim rests on.
Not obtained: where the underlying document is named above but not linked, we did not hold a copy at the time of publication. We purchase nothing and request nothing in our own name.
Corrections
None on this report. If you find an error, it will be published here, at the same length, with the date it was found, and the original wording will remain visible above it.