Enugu is third on NBS's 2025 state revenue table because of one line: N355.25bn of agency revenue, 87 per cent of its total and more than Lagos reports
The National Bureau of Statistics ranks Enugu third among states for 2025 internally generated revenue, at N406.77 billion. Its own panel for the state shows N355.25 billion of that came from ministries, departments and agencies, not taxes, a larger sum than Lagos reports in the same category. On tax revenue alone, Enugu ranks 14th. Its agency revenue was N10.96 billion in 2023.

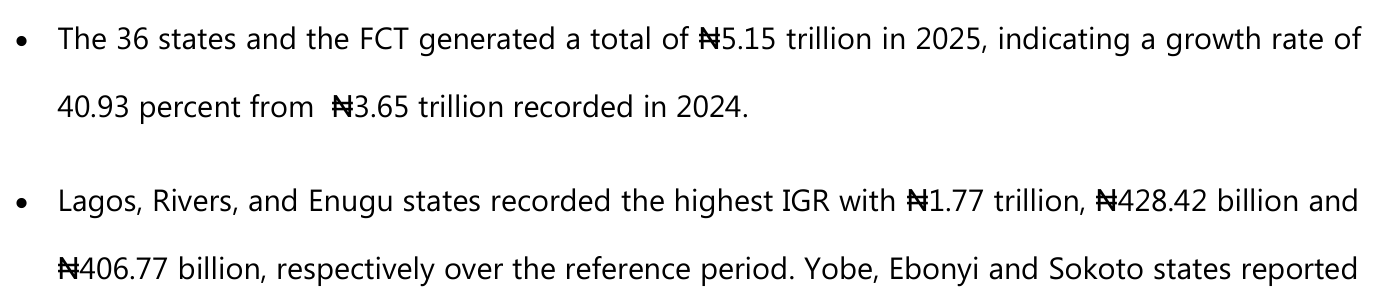
The National Bureau of Statistics published its report on Internally Generated Revenue at State Level for 2025 in September 2026, with a 15-page PDF and a spreadsheet of state figures from 2019 to 2025. Its key highlights, on page 4, say the 36 states and the FCT raised N5.15 trillion in 2025, 40.93 per cent more than the N3.65 trillion of 2024, and that "Lagos, Rivers, and Enugu states recorded the highest IGR with N1.77 trillion, N428.42 billion and N406.77 billion, respectively".
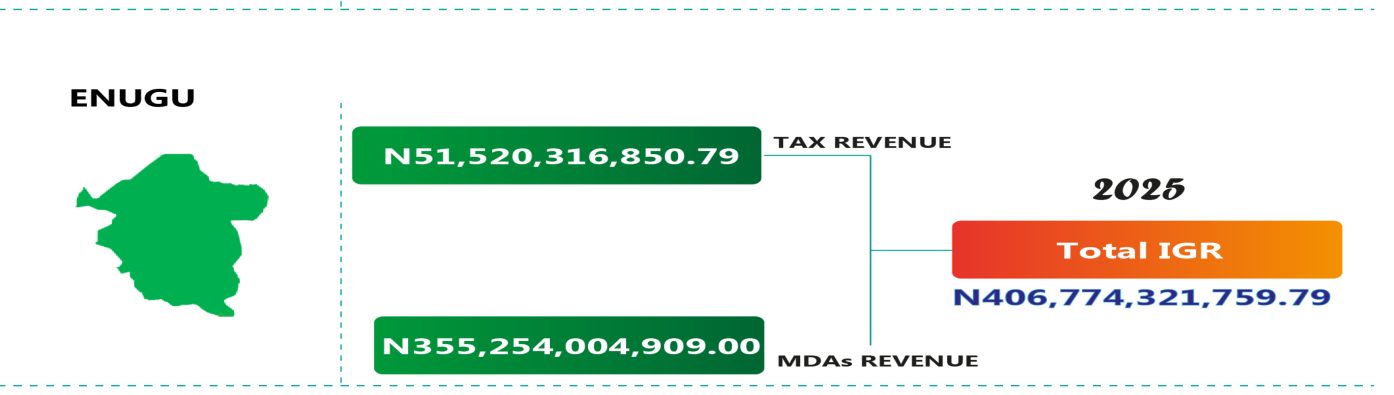
Enugu's place in that list rests almost entirely on one of the two categories the report counts. On page 8, the Bureau's panel for Enugu gives tax revenue of N51,520,316,850.79 and MDAs revenue, money raised by state ministries, departments and agencies, of N355,254,004,909.00. Together they make the N406,774,321,759.79 total. MDAs revenue is 87.33 per cent of it.
That is the highest MDAs share of any state in the 2025 table. Across all 37 jurisdictions, MDAs revenue was 26.36 per cent of IGR; the report itself puts tax at 73.64 per cent. In Lagos the MDAs share was 16.54 per cent, in Rivers 3.28 per cent.
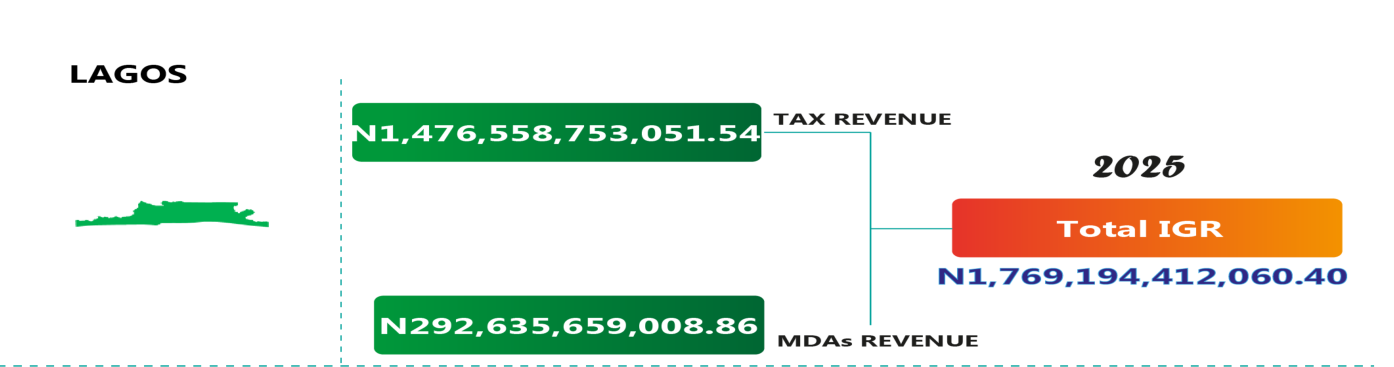
In absolute terms, Enugu's MDAs line is the largest in the country. Lagos, whose panel on page 11 shows total IGR of N1,769,194,412,060.40, reports MDAs revenue of N292,635,659,008.86. Enugu's figure is N62.62 billion higher. Of the N1.36 trillion of MDAs revenue reported nationally, Enugu accounts for 26.18 per cent.
Ranked by tax revenue alone, the larger of the report's two categories, Enugu's N51.52 billion places it 14th of 37 on the Bureau's own spreadsheet. Its PAYE, N25.25 billion, ranks 15th.
The spreadsheet shows how fast the MDAs line grew. Enugu reported MDAs revenue of N11,467,110,638.28 for 2022 and N10,960,609,969.88 for 2023. For 2024 the figure is N149,651,263,321.00 and for 2025 N355,254,004,909.00: 32.4 times the 2023 level, and up N205.60 billion, or 137.39 per cent, in a single year.
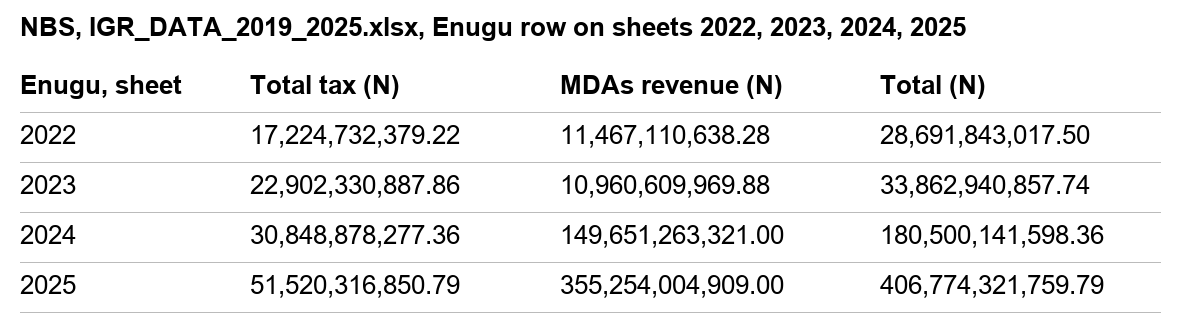
That one-year rise matters for the national figure as well. MDAs revenue across all states rose by N388.98 billion between 2024 and 2025, and Enugu's increase is 52.86 per cent of it. Enugu's total IGR rose by N226.27 billion, which is 15.13 per cent of the N1.50 trillion national increase behind the Bureau's 40.93 per cent growth figure.
The report does not break MDAs revenue down by agency or source for any state, and it does not comment on Enugu's figure. Its methodology page says the data are compiled by the Joint Revenue Board from submissions by the State Boards of Internal Revenue, and that "Figures are subject to reconciliations and updates by the respective sub-national revenue authorities."
The record also supports Enugu on the measure that is easiest to compare. Its tax revenue rose from N30,848,878,277.36 in 2024 to N51,520,316,850.79 in 2025, an increase of 67.01 per cent, well above the national rise in tax revenue of 41.20 per cent. The Bureau's arithmetic also holds: every state row in the 2025 table adds across, and the columns add to the stated national totals.
Two other entries point the other way on the same line. The FCT reports no MDAs revenue for 2025, against N19,284,110,461 in 2024, and Abia reports none, against N10,567,619,780.49 in 2024. The report does not explain either blank.
What the documents establish is narrow: by the Bureau's own figures, Enugu is the third-highest IGR state of 2025 because of a category in which it reports more than Lagos, while on taxes it sits in the middle of the table. What lies inside the N355.25 billion, whether it includes receipts other states book elsewhere, and whether it will survive the reconciliation the Bureau mentions, the published report does not say.
What this rests on
NBS, Internally Generated Revenue at State Level (2025), report date September 2026, 15 pages (IGR_2025.pdf), and the companion spreadsheet IGR_DATA_2019_2025.xlsx, both in IGR_2025.zip downloaded on 6 October 2026 from the NBS microdata portal (download id 1436) and read for this report. Arithmetic, re-done from the spreadsheet and checked against the PDF panels: Enugu 2025: 51,520,316,850.79 + 355,254,004,909.00 = 406,774,321,759.79 (p.8); 355,254,004,909.00 / 406,774,321,759.79 = 87.33%. Lagos 2025 MDAs 292,635,659,008.86 (p.11); 355,254,004,909.00 minus 292,635,659,008.86 = 62,618,345,900.14. National MDAs 2025 1,357,137,509,131.10; Enugu share 26.18%; national MDAs share of IGR 1,357,137,509,131.10 / 5,149,040,235,770.33 = 26.36%, tax share 73.64% (matches p.4). Lagos MDAs share 292.64 / 1,769.19 = 16.54%; Rivers 14.03 / 428.42 = 3.28%. Enugu MDAs: 2022 11,467,110,638.28; 2023 10,960,609,969.88; 2024 149,651,263,321.00; 2025 355,254,004,909.00; 2025 / 2023 = 32.41; 2025 minus 2024 = 205,602,741,588.00 (+137.39%). National MDAs 2024 968,161,892,540.99; rise 388,975,616,590.11; Enugu share of rise 52.86%. Enugu total 2024 180,500,141,598.36; rise 226,274,180,161.43; national total rise 5,149,040,235,770.33 minus 3,653,579,954,252.90 = 1,495,460,281,517.43; Enugu share 15.13%; growth 40.93% (matches p.4). Enugu tax 2024 30,848,878,277.36 to 51,520,316,850.79 = +67.01%; national tax 2,685,418,061,711.91 to 3,791,902,726,639.23 = +41.20%. Ranks among 37: Enugu 14th by total tax, 15th by PAYE, 1st by MDAs revenue. Every 2025 state row re-added (eight tax heads to total tax; tax plus MDAs to total) with zero difference.
What this does not establish
What makes up Enugu's N355.25 billion of MDAs revenue, which agencies raised it, whether it includes items other states classify differently (for example capital receipts, transfers or one-off sales), and why it rose from N10.96 billion in 2023. The report gives no breakdown, and Vero Record has not obtained Enugu State's own 2025 financial statements or comment from the Enugu State Internal Revenue Service or the Joint Revenue Board. Why the FCT and Abia report no MDAs revenue for 2025. Whether the figures will change after the reconciliation the Bureau's note mentions. Nothing in the documents suggests wrongdoing by anyone and none is alleged.
What we did ourselves
Downloaded the NBS 2025 state IGR report and spreadsheet, re-added every state row and the national totals, ranked states separately by tax revenue, PAYE and MDAs revenue, and traced Enugu's MDAs revenue across the 2022 to 2025 sheets against Lagos and the national figures.
Sources for this report
(A) National Bureau of Statistics, Internally Generated Revenue at State Level (2025), September 2026, pp.3, 4, 8, 11; and IGR_DATA_2019_2025.xlsx, sheets 2022, 2023, 2024 and 2025.
- Internally Generated Revenue at State Level (2025), report and data (IGR_2025.zip) · National Bureau of Statistics · September 2026
Confidence: high. This is our own assessment of whether the event occurred as described, separate from the grade, which describes what kind of thing the claim rests on.
Not obtained: where the underlying document is named above but not linked, we did not hold a copy at the time of publication. We purchase nothing and request nothing in our own name.
Corrections
None on this report. If you find an error, it will be published here, at the same length, with the date it was found, and the original wording will remain visible above it.

Dr VeroInvestigations editor, Vero Record
Reads the Nigerian public record that others leave unread: budgets, audit reports, court files and registers. Every claim on this page carries the grade of the document behind it, and the report says what that document does not establish.
All 97 reportsHow we grade evidenceAdd Vero Record as a preferred source on Google