
Budget Office puts Q2 2026 domestic debt rise at N8.71tn; DMO tables show N4.19tn, and the N4.52tn gap is what states and the FCT owed in March
The Budget Office of the Federation's second-quarter 2026 implementation report says Nigeria's domestic debt rose N8.71 trillion, or 10.51 per cent, between March and June. It gets there by setting the June total for the federal government, states and FCT against a March figure for the federal government alone. The Debt Management Office's tables put the like-for-like rise at N4.19 trillion, or 4.79 per cent. The N4.52 trillion difference is, to the naira, what the states and FCT already owed on 31 March. The report's other debt figures hold.
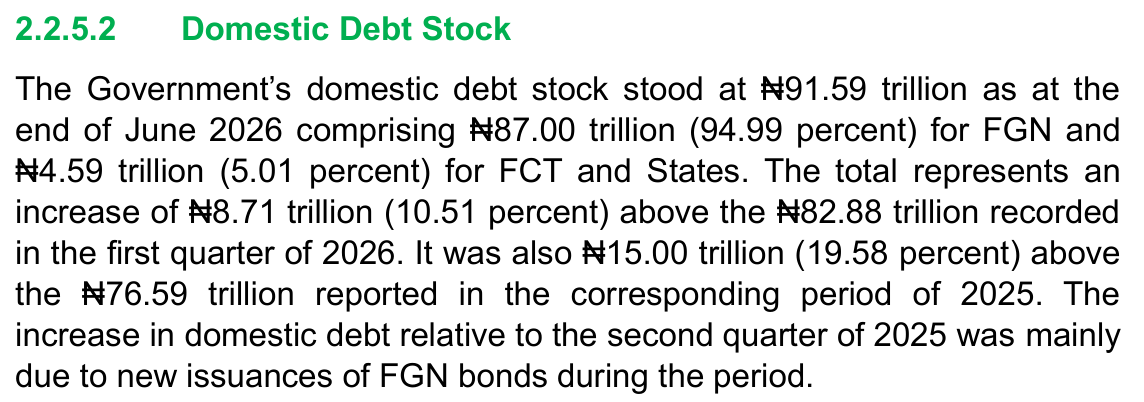
Nigeria's domestic public debt rose by N4.19 trillion between the end of March and the end of June 2026, according to the Debt Management Office's own tables. The Budget Office of the Federation's implementation report for the same quarter, posted on its website on 7 November, puts the rise at N8.71 trillion, more than twice as much. Section 2.2.5.2 on page 13 of the report reads: "The Government's domestic debt stock stood at N91.59 trillion as at the end of June 2026 comprising N87.00 trillion (94.99 percent) for FGN and N4.59 trillion (5.01 percent) for FCT and States. The total represents an increase of N8.71 trillion (10.51 percent) above the N82.88 trillion recorded in the first quarter of 2026." The June figure is correct. The March figure it is set against is not the same measure.
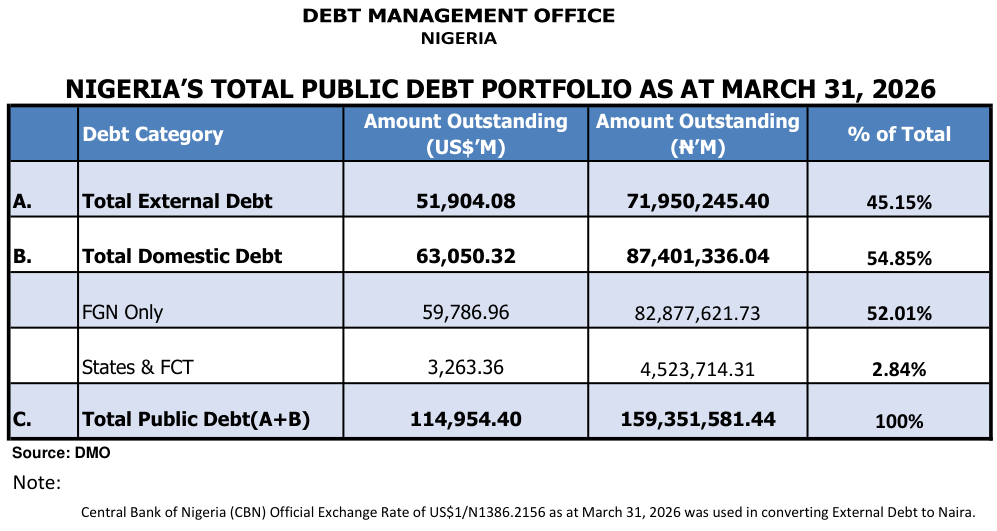
The Debt Management Office's table of Nigeria's total public debt as at 31 March 2026 gives total domestic debt of N87,401,336.04 million. It splits that into N82,877,621.73 million for the federal government ("FGN Only") and N4,523,714.31 million for the states and the Federal Capital Territory. The N82.88 trillion in the Budget Office's sentence is the federal government's share alone. The Budget Office's own first-quarter report, released earlier this month, uses it that way: on page 13 it says "The Federal Government's domestic debt stock stood at N82.88 trillion as at the end of March, 2026", and on page 12 it gives total domestic debt at the same date as N87.40 trillion.
Measured like for like, the rise is a little under half the published one. The Debt Management Office's table as at 30 June 2026 gives total domestic debt of N91,590,433.92 million, made up of N86,999,153.24 million for the federal government and N4,591,280.68 million for the states and FCT. Against the March total of N87,401,336.04 million, that is a rise of N4,189,097.88 million, or 4.79 per cent. The federal government's own domestic debt rose by N4,121,531.51 million (4.97 per cent), and that of the states and FCT by N67,566.37 million (1.49 per cent). The report's figure is N91,590,433.92 million minus N82,877,621.73 million, which is N8,712,812.19 million. The difference between the two, N4,523,714.31 million, is to the naira the domestic debt the states and FCT already owed on 31 March. The report counts that whole stock as if it had been added in the quarter.
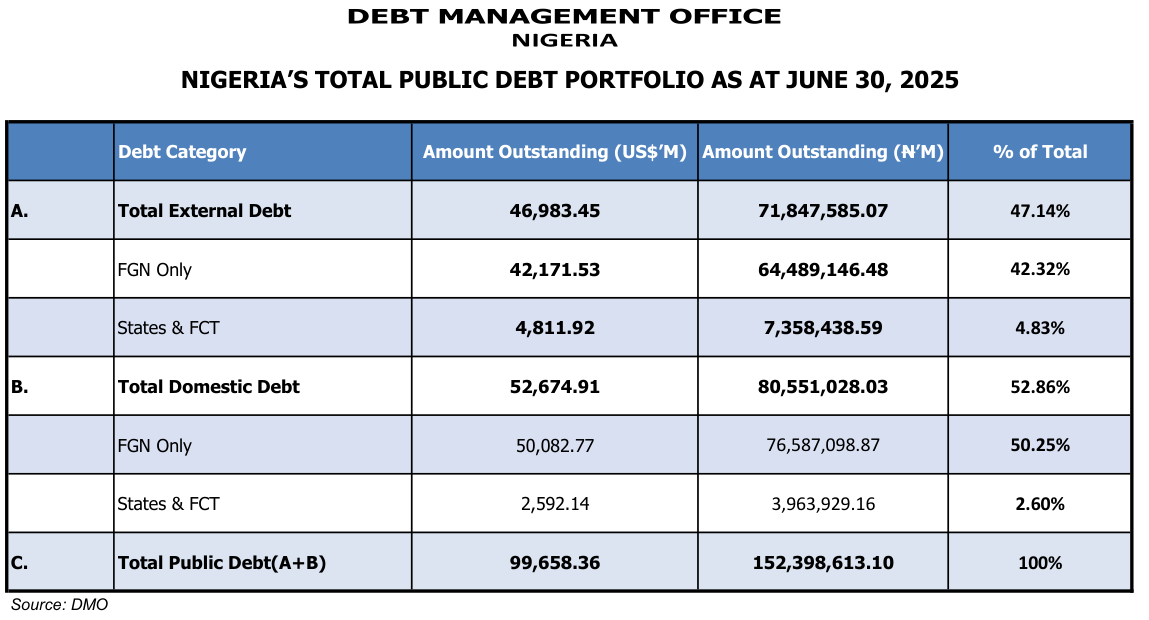
The year-on-year comparison in the next sentence is built the same way. The report says the June 2026 stock "was also N15.00 trillion (19.58 percent) above the N76.59 trillion reported in the corresponding period of 2025". The Debt Management Office's table as at 30 June 2025 shows N76,587,098.87 million for the federal government only, and total domestic debt of N80,551,028.03 million once the states' and FCT's N3,963,929.16 million is included. Like for like, domestic debt rose by N11,039,405.89 million over the year, or 13.70 per cent; federal domestic debt alone rose by N10,412,054.37 million, or 13.60 per cent. The report's N15.00 trillion overstates the annual rise by N3,963,929.16 million, again exactly the states' and FCT's stock at the starting date.
The report's own figures do not allow its N8.71 trillion. One section earlier, on page 12, it says total public debt, domestic and external together, "stood at N166.79 trillion" on 30 June, "an increase of N7.44 trillion (4.67 percent)" on the end of March. Domestic debt cannot have grown by N8.71 trillion inside a total that grew by N7.44 trillion while external debt was also growing: page 13 says external debt rose by US$2.62 billion in the quarter. In naira, the Debt Management Office's tables show external debt rising from N71,950,245.40 million to N75,198,046.27 million, an increase of N3,247,800.87 million. Added to the like-for-like domestic rise of N4,189,097.88 million, that gives N7,436,898.75 million, the N7.44 trillion the report prints.
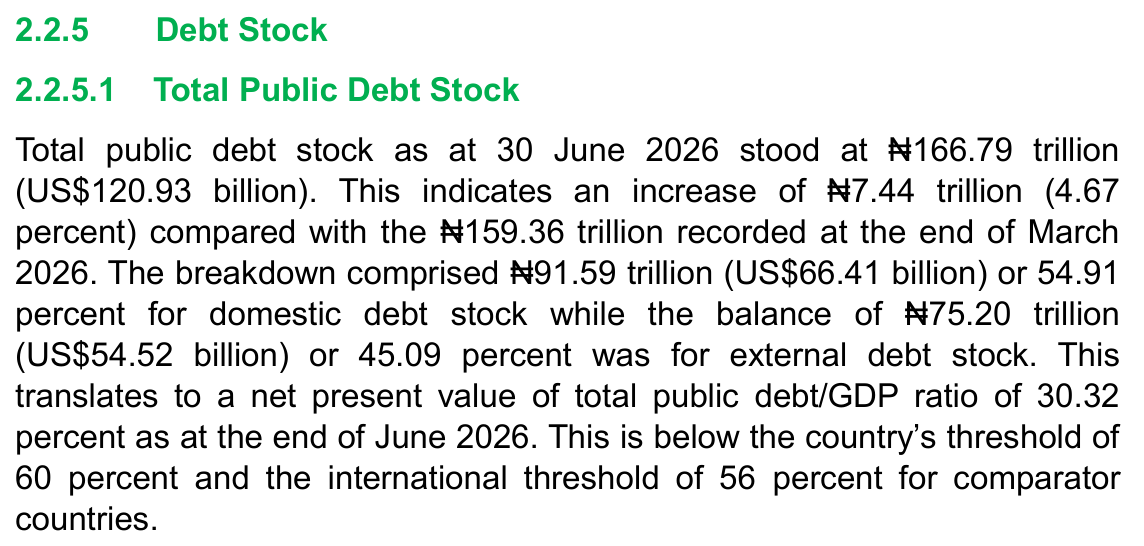
Apart from that paragraph, the debt section of the report matches the Debt Management Office's record. Total public debt of N166.79 trillion (US$120.93 billion), the rise of N7.44 trillion and the 4.67 per cent are correct; the report's March base of N159.36 trillion is N0.01 trillion above the office's N159,351,581.44 million, a rounding difference, and the first-quarter report itself used N159.35 trillion. The external debt paragraph is exact: US$54.52 billion, up US$2.62 billion (5.05 per cent) from US$51.90 billion in March and US$7.54 billion (16.05 per cent) from US$46.98 billion a year earlier, against the office's US$54,523.57 million, US$51,904.08 million and US$46,983.45 million. The breakdown of federal domestic debt, N64.84 trillion of bonds (74.53 per cent), N19.48 trillion of Treasury bills (22.39 per cent) and the smaller lines, matches the office's instrument table for 30 June. In the fiscal account, Table 3.9 on page 36, domestic debt service of N3,138.89 billion in the first quarter and N2,143.97 billion in the second matches the office's tables of actual domestic debt service, N3,138,892,348,344.38 and N2,143,966,217,888.82.
The first-quarter report's paragraph on domestic debt dealt only with the federal government and compared like with like: N82.88 trillion at the end of March against N80.49 trillion at the end of December, a rise of N2.39 trillion, or 2.97 per cent. The Debt Management Office's tables give N82,877,621.73 million and N80,488,865.11 million, a difference of N2,388,756.62 million, so that paragraph holds. The second-quarter paragraph keeps the same structure and the same kind of comparison figures, but opens with a total that now includes the states and FCT. The report does not say why the basis changed.
The Debt Management Office's instrument tables show what did drive the federal government's N4,121.53 billion rise in the quarter. Treasury bills went from N16,566,899,525,000.00 to N19,482,871,408,000.00, an increase of N2,915.97 billion that accounts for 70.75 per cent of the rise. Naira bonds went up by N2,003.97 billion. Against that, the bond that converted the Central Bank's Ways and Means advances fell by N613.34 billion, promissory notes by N169.86 billion and the green bond by N15.00 billion, and the naira value of the dollar bond fell by N6.45 billion as the exchange rate moved from N1,386.2156 to N1,379.1842; savings bonds rose by N6.24 billion. These add to the N4,121.53 billion. Over the year to June the pattern is similar: Treasury bills rose by N6,718.79 billion and FGN bonds as a whole by N4,193.46 billion. The report says the annual increase "was mainly due to new issuances of FGN bonds". On the net stock figures, Treasury bills grew more.
The fall in the Ways and Means bond is the first in the tables examined. The office's instrument tables for June 2025, December 2025 and March 2026 each list it at N22,719,000,000,000.00; the June 2026 table gives N22,105,657,728,000.00. The office's table of actual domestic debt service for April to June records principal repayments only on promissory notes, N164,281,728,821.27 in all, and its N93,590,984,788.00 for local currency promissory notes equals, to the naira, the fall in their stock. It records no bond principal of any kind: the N15.00 billion fall in the green bond does not appear in it either, so the table's silence does not show how the Ways and Means reduction was settled. The Budget Office's Table 3.9 has a line for "Interest on FGN Bond for securitized Ways & Means"; it reads 0.00 in the budget and in both quarters. A Nairametrics headline on 28 September linked the fall to the end of a moratorium. Neither the Debt Management Office's tables nor the Budget Office report read for this story says so.
The implementation report is the government's main quarterly account of how the budget is being carried out, and its debt section is where readers look for how fast borrowing is growing. On the report's figures, domestic debt grew by more than a tenth in three months. On the figures of the Debt Management Office, which the report names as the source of its debt chart, it grew by under a twentieth: N4.19 trillion, 4.79 per cent. The N91.59 trillion end-June stock, the N166.79 trillion total and the external debt figures in the same report are correct.
The documents do not show how the comparison came to be built on two different measures, or whether the Budget Office intends to correct it. They do not explain the N613.34 billion fall in the Ways and Means bond, or why the 2026 budget provides nothing for interest on it. Nothing in the documents suggests wrongdoing by anyone, and none is alleged. The Budget Office and the Debt Management Office were not asked for comment before publication; the figures above are their own, set against each other.
What this rests on
Budget Office of the Federation, Second Quarter 2026 Budget Implementation Report (56 pages; copy retrieved by Vero Record from budgetoffice.gov.ng on 9 November 2026; the live file was checked again on 11 November and has the same size, 2,204,610 bytes, and a file date of 7 November 2026): section 2.2.5.1, printed p.12 (PDF p.28); section 2.2.5.2 and 2.5.3, printed p.13 (PDF p.29); Table 3.9, printed p.36 (PDF p.52). Budget Office, 2026 First Quarter Budget Implementation Report (52 pages, retrieved 4 November 2026): printed pp.12 and 13 (PDF pp.28 and 29). Debt Management Office tables retrieved from dmo.gov.ng between 29 September and 18 October 2026: Nigeria's Total Public Debt Portfolio as at June 30, 2025 (5541), March 31, 2026 (6002) and June 30, 2026 (6080); FGN Domestic Debt Stock by Instruments as at June 30, 2025 (5533), December 31, 2025 (5810), March 31, 2026 (5998) and June 30, 2026 (6075); Actual Domestic Debt Service, January to March 2026 (6003) and April to June 2026 (6076). All were read for this report. Arithmetic re-done (N million unless stated): March 2026 parts 82,877,621.73 + 4,523,714.31 = 87,401,336.04; June 2026 parts 86,999,153.24 + 4,591,280.68 = 91,590,433.92; June 2025 parts 76,587,098.87 + 3,963,929.16 = 80,551,028.03. Report basis: 91,590,433.92 - 82,877,621.73 = 8,712,812.19 (10.51%); like for like 91,590,433.92 - 87,401,336.04 = 4,189,097.88 (4.79%); federal only 86,999,153.24 - 82,877,621.73 = 4,121,531.51 (4.97%); states and FCT 4,591,280.68 - 4,523,714.31 = 67,566.37 (1.49%); 8,712,812.19 - 4,189,097.88 = 4,523,714.31 = states and FCT stock at 31 March 2026; 8,712,812.19 / 4,189,097.88 = 2.08 times. Year on year: report basis 91,590,433.92 - 76,587,098.87 = 15,003,335.05 (19.59%; the report's 19.58% is 15.00 / 76.59); like for like 91,590,433.92 - 80,551,028.03 = 11,039,405.89 (13.70%); federal only 86,999,153.24 - 76,587,098.87 = 10,412,054.37 (13.60%); 15,003,335.05 - 11,039,405.89 = 3,963,929.16 = states and FCT stock at 30 June 2025. Total public debt: 87,401,336.04 + 71,950,245.40 = 159,351,581.44; 91,590,433.92 + 75,198,046.27 = 166,788,480.19; 166,788,480.19 - 159,351,581.44 = 7,436,898.75 (4.67%) = 4,189,097.88 + 3,247,800.87 (external 75,198,046.27 - 71,950,245.40). External US$ million: 54,523.57 - 51,904.08 = 2,619.49 (5.05%); 54,523.57 - 46,983.45 = 7,540.12 (16.05%). First-quarter report: 82,877,621.73 - 80,488,865.11 = 2,388,756.62 (2.97%). Federal instruments, March to June 2026 (N billion): Treasury bills 19,482.87 - 16,566.90 = +2,915.97; naira bonds 41,467.75 - 39,463.78 = +2,003.97; Ways and Means bond 22,105.66 - 22,719.00 = -613.34; dollar bond 1,265.27 - 1,271.72 = -6.45; savings bonds 122.45 - 116.21 = +6.24; green bond 47.355 - 62.355 = -15.00; promissory notes 1,215.24 - 1,385.10 = -169.86; sukuk and UFTF unchanged; sum +4,121.53 = total 86,999.15 - 82,877.62; bills share 2,915.97 / 4,121.53 = 70.75%. June 2025 to June 2026: Treasury bills 19,482.87 - 12,764.08 = +6,718.79; FGN bonds 64,838.68 - 60,645.22 = +4,193.46 (naira bonds +4,944.44). Promissory notes: naira P-note stock 300,405,996,661.00 - 206,815,011,873.00 = 93,590,984,788.00 = local P-note principal paid April to June; total P-note principal 93,590,984,788.00 + 70,690,744,033.27 = 164,281,728,821.27. Debt service: DMO 3,138,892,348,344.38 and 2,143,966,217,888.82 against Table 3.9's N3,138.89bn and N2,143.97bn.
What this does not establish
Why the second-quarter report set a federal-plus-states total against federal-only comparison figures, and whether the Budget Office will correct the paragraph; the report does not say, and neither office was asked for comment before publication. Why the securitised Ways and Means bond fell by N613.34 billion in the quarter and how the reduction was settled: the Debt Management Office's debt service tables do not list bond principal, and the Nairametrics account linking it to the end of a moratorium was not checked against a primary record. Why the 2026 budget and both quarterly actuals show 0.00 for interest on that bond. Whether gross issuance of FGN bonds exceeded that of Treasury bills over the year; this report compares net changes in stock only, and the June 2025 table notes that its bond and bill figures include part of N7.3 trillion of Ways and Means advances restructured in the first half of 2025. The domestic debt figures for the states and FCT are those the states submitted to the Debt Management Office and were not checked against state accounts here. Nothing in the documents suggests wrongdoing by anyone, and none is alleged.
What we did ourselves
Set every figure in the debt section of the Budget Office's second-quarter 2026 report against the Debt Management Office's tables for the same dates. Found that the domestic debt paragraph compares a federal-plus-states total with federal-only figures, recomputed the quarterly and annual rises on both consistent bases, and showed that each overstatement equals the states' and FCT's stock at the starting date. Checked the result against the report's own total public debt figure, which it contradicts, and against the first-quarter report, which compared like with like. Confirmed where the report holds: the total and external debt figures, the instrument breakdown and the domestic debt service in Table 3.9. Broke the federal government's quarterly and annual increase down by instrument and reconciled the parts to the totals.
Sources for this report
(A) Budget Office of the Federation, Second Quarter 2026 Budget Implementation Report, sections 2.2.5.1 to 2.5.3 (pp.12 to 13) and Table 3.9 (p.36); 2026 First Quarter Budget Implementation Report, pp.12 to 13; Debt Management Office, Nigeria's Total Public Debt Portfolio as at June 30, 2025, March 31, 2026 and June 30, 2026, FGN Domestic Debt Stock by Instruments for the same dates and December 31, 2025, and Actual Domestic Debt Service for January to March and April to June 2026.
- Second Quarter 2026 Budget Implementation Report (56 pages) · Budget Office of the Federation, Ministry of Budget and Economic Planning · 7 November 2026
- 2026 First Quarter Budget Implementation Report (52 pages) · Budget Office of the Federation, Ministry of Budget and Economic Planning · 2 November 2026
- Nigeria's Total Public Debt Portfolio as at March 31, 2026 · Debt Management Office · 2026
- Nigeria's Total Public Debt Portfolio as at June 30, 2026 · Debt Management Office · September 2026
- Nigeria's Total Public Debt Portfolio as at June 30, 2025 · Debt Management Office · 2025
- FGN Domestic Debt Stock Outstanding by Instruments as at June 30th, 2026 · Debt Management Office · 2026
- FGN Domestic Debt Stock Outstanding by Instruments as at March 31st, 2026 · Debt Management Office · 2026
- FGN Domestic Debt Stock Outstanding by Instruments as at December 31st, 2025 (provisional) · Debt Management Office · 2026
- FGN Domestic Debt Stock Outstanding by Instruments as at June 30, 2025 · Debt Management Office · 2025
- Actual Domestic Debt Service from April to June 2026 · Debt Management Office · 2026
- Actual Domestic Debt Service for January to March 2026 · Debt Management Office · 2026
- Nigeria's public debt rises to N166.79 trillion in Q2 2026 · Nairametrics · 26 September 2026
- FG's securitised Ways and Means debt drops N613 billion as moratorium ends · Nairametrics · 28 September 2026
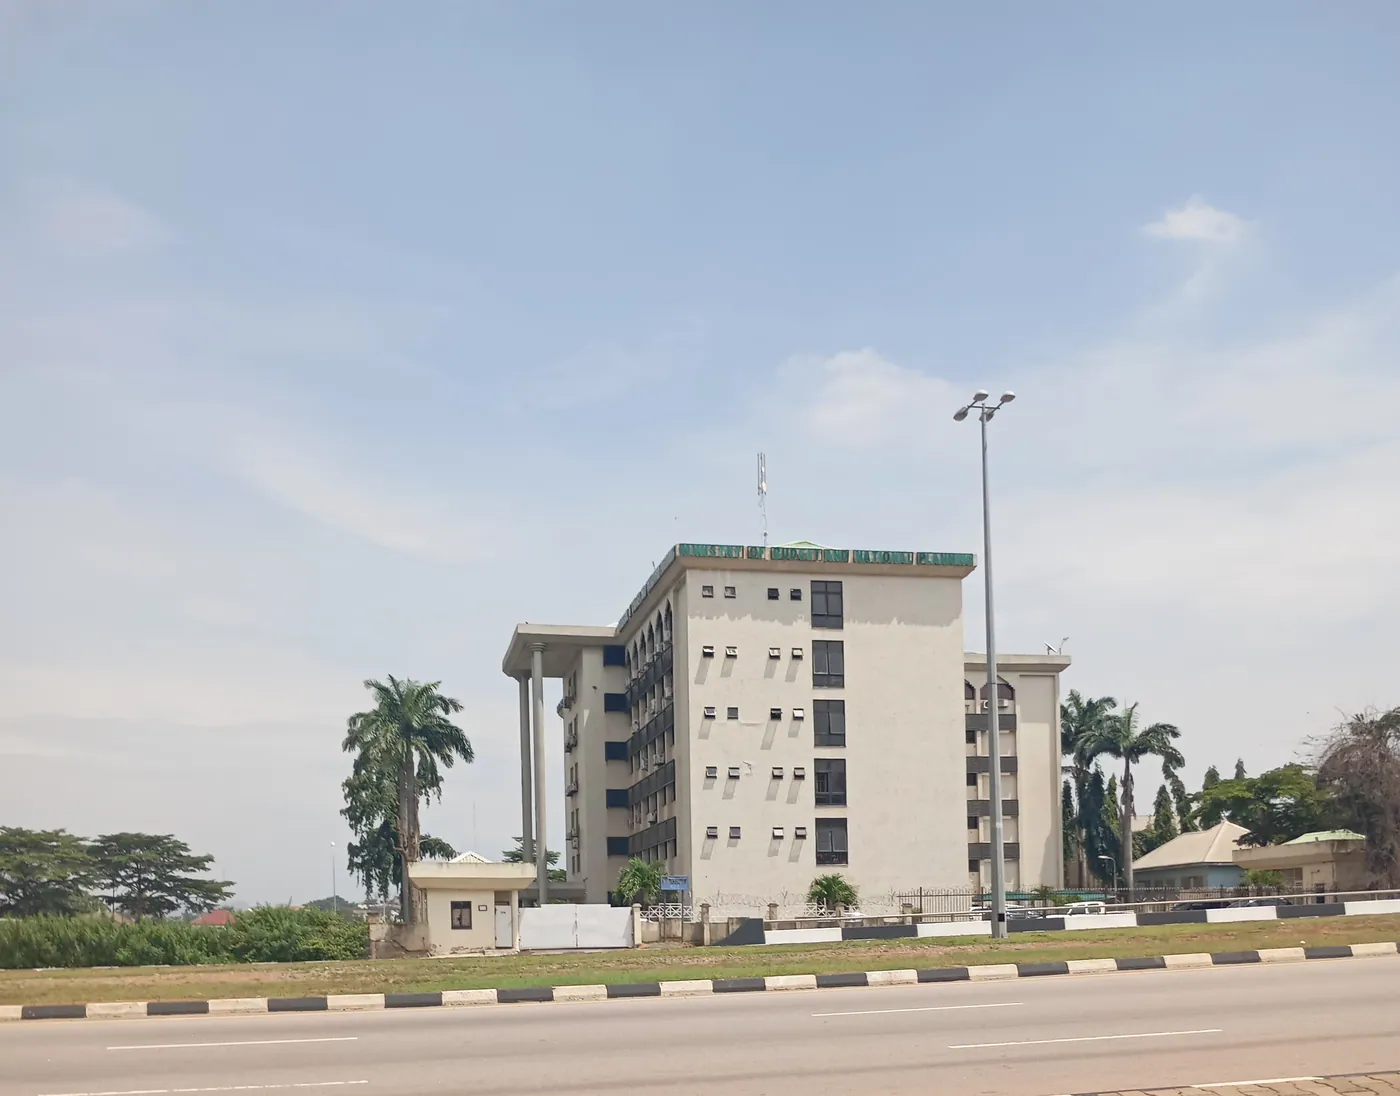
- File:Ministry of Budget and National Planning Abuja.jpg · Wikimedia Commons (Gwanki, CC0) · 17 September 2024
Confidence: high. This is our own assessment of whether the event occurred as described, separate from the grade, which describes what kind of thing the claim rests on.
Not obtained: where the underlying document is named above but not linked, we did not hold a copy at the time of publication. We purchase nothing and request nothing in our own name.
Corrections
None on this report. If you find an error, it will be published here, at the same length, with the date it was found, and the original wording will remain visible above it.
Dr VeroInvestigations editor, Vero Record
Reads the Nigerian public record that others leave unread: budgets, audit reports, court files and registers. Every claim on this page carries the grade of the document behind it, and the report says what that document does not establish.
All 196 reportsHow we grade evidenceAdd Vero Record as a preferred source on Google