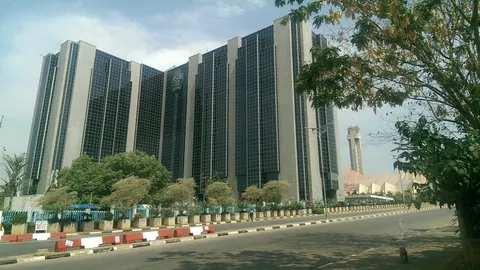
Inflation eased to 14.63% in September, the lowest since 2020. NBS's table credits food with adding 0.02 points; its own workbook shows food took about 0.38 off
Headline inflation fell to 14.63 per cent in September 2026 from 15.39 per cent in August. The National Bureau of Statistics' report says food added 0.02 points to the month's 0.06 per cent rise, but every figure in its contribution tables is simply the headline rate times the division's weight. The workbook released with the report shows the food division's index falling 0.92 per cent, which took about 0.38 points off the month, while transport, restaurants, education and housing pushed prices up. The headline rates themselves check out, and they bear out the World Bank's description of a plateau around 15.5 per cent.
Nigeria's headline inflation rate fell to 14.63 per cent in September 2026, from 15.39 per cent in August, the National Bureau of Statistics reported on Thursday 15 October. The Bureau's report also tells readers which parts of the shopping basket moved prices. Its table of divisional contributions on page 7 credits food and non-alcoholic beverages with adding 0.02 points to the month's 0.06 per cent rise. The workbook the Bureau published with the report shows the opposite. The food division's index fell from 150.84 in August to 149.45 in September, a drop of 0.92 per cent, and on the workbook's own weights that took about 0.38 points off the month. Transport, restaurants, education and housing pushed the other way.
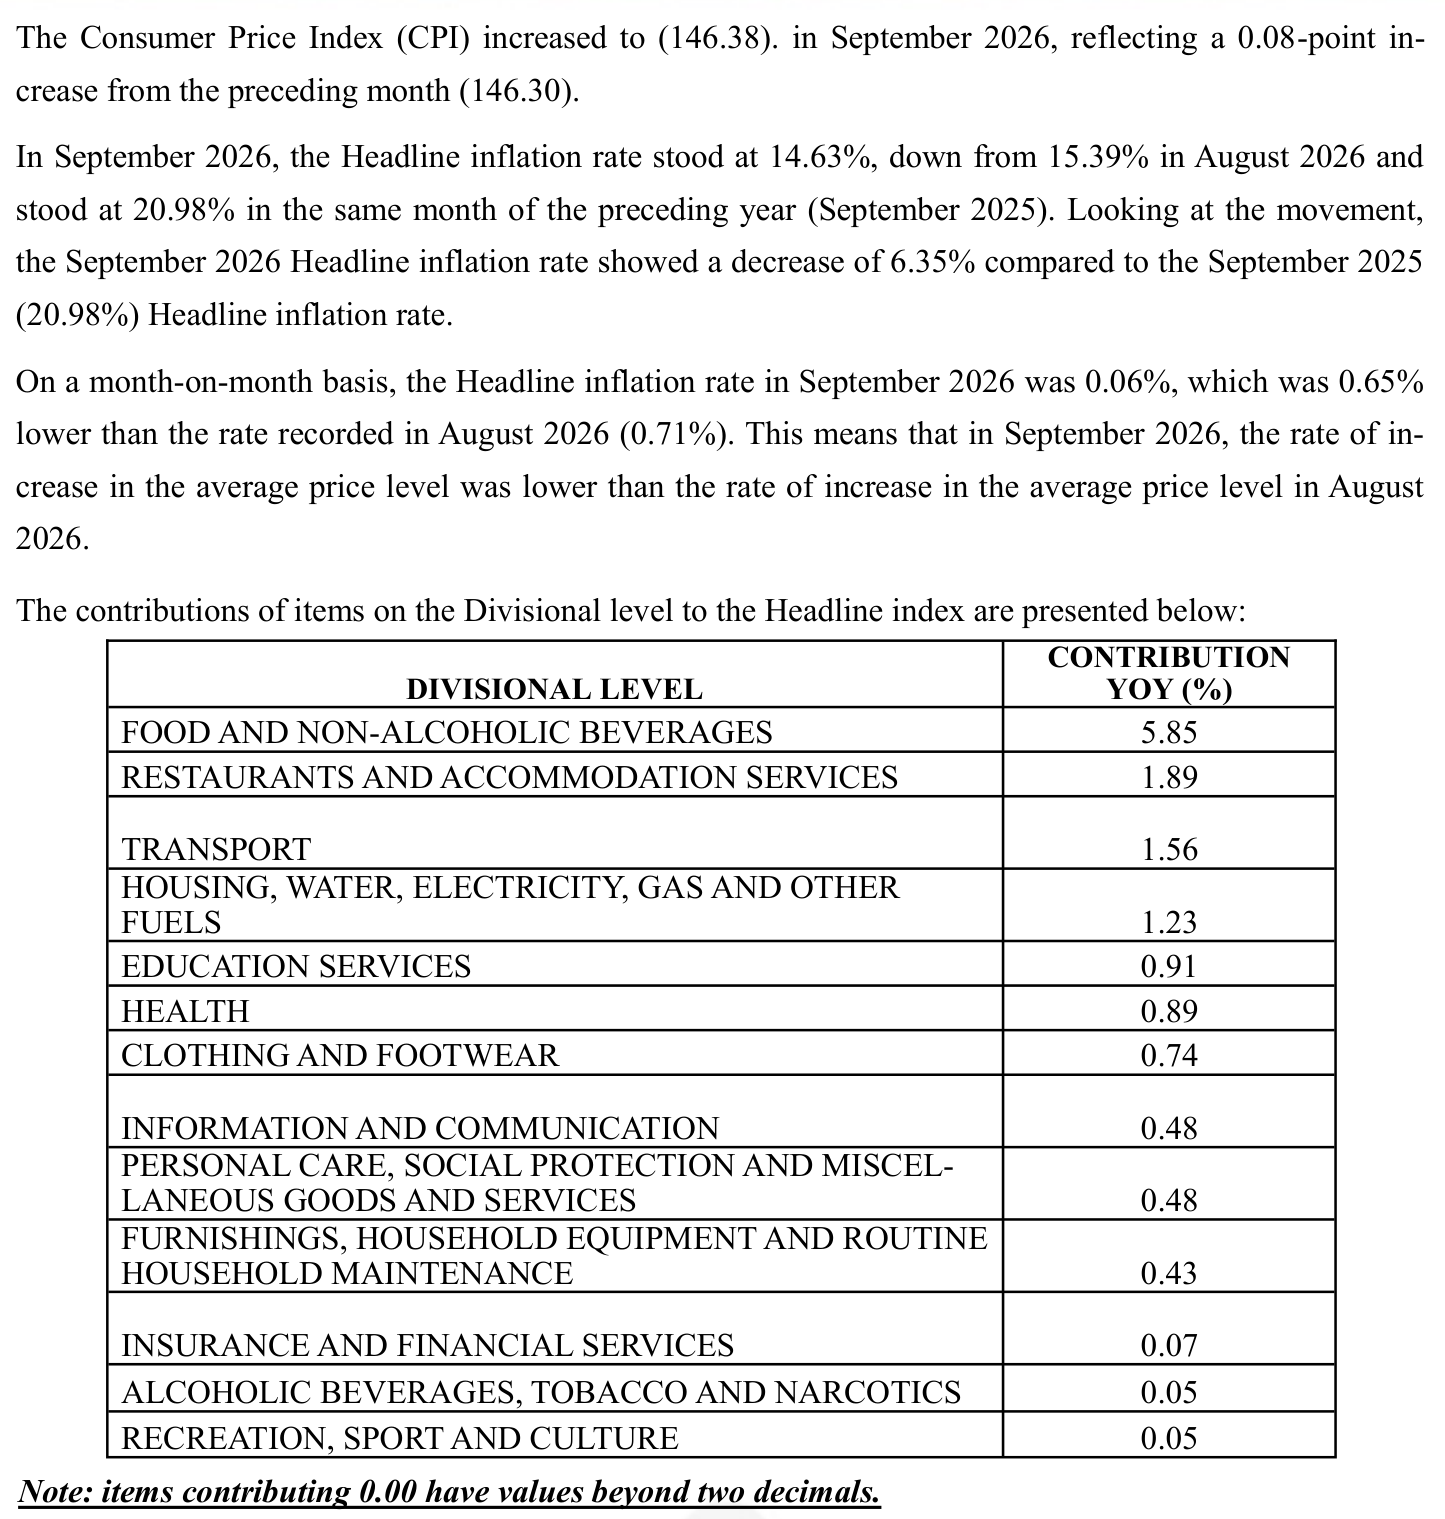
Vero Record retrieved the September release from the Bureau's microdata catalogue, where it is posted as a zip file holding the 21-page report and an Excel workbook, cpi_1New_September2026.xlsx. The Bureau's servers did not answer direct requests from our location on Thursday, so the file was fetched through an Internet Archive capture made the same afternoon. We also used the August 2026 report and workbook from the same catalogue. The headline figures recompute exactly from the workbook. The all-items index stands at 146.38 in September 2026, against 127.70 a year earlier and 146.30 in August, which gives 14.63 per cent year on year and 0.06 per cent month on month. The 0.76-point fall in the annual rate is plain base arithmetic: prices rose 0.72 per cent in September 2025 and only 0.06 per cent in September 2026, and 1.1539 x 1.0006 / 1.0072 = 1.1463.
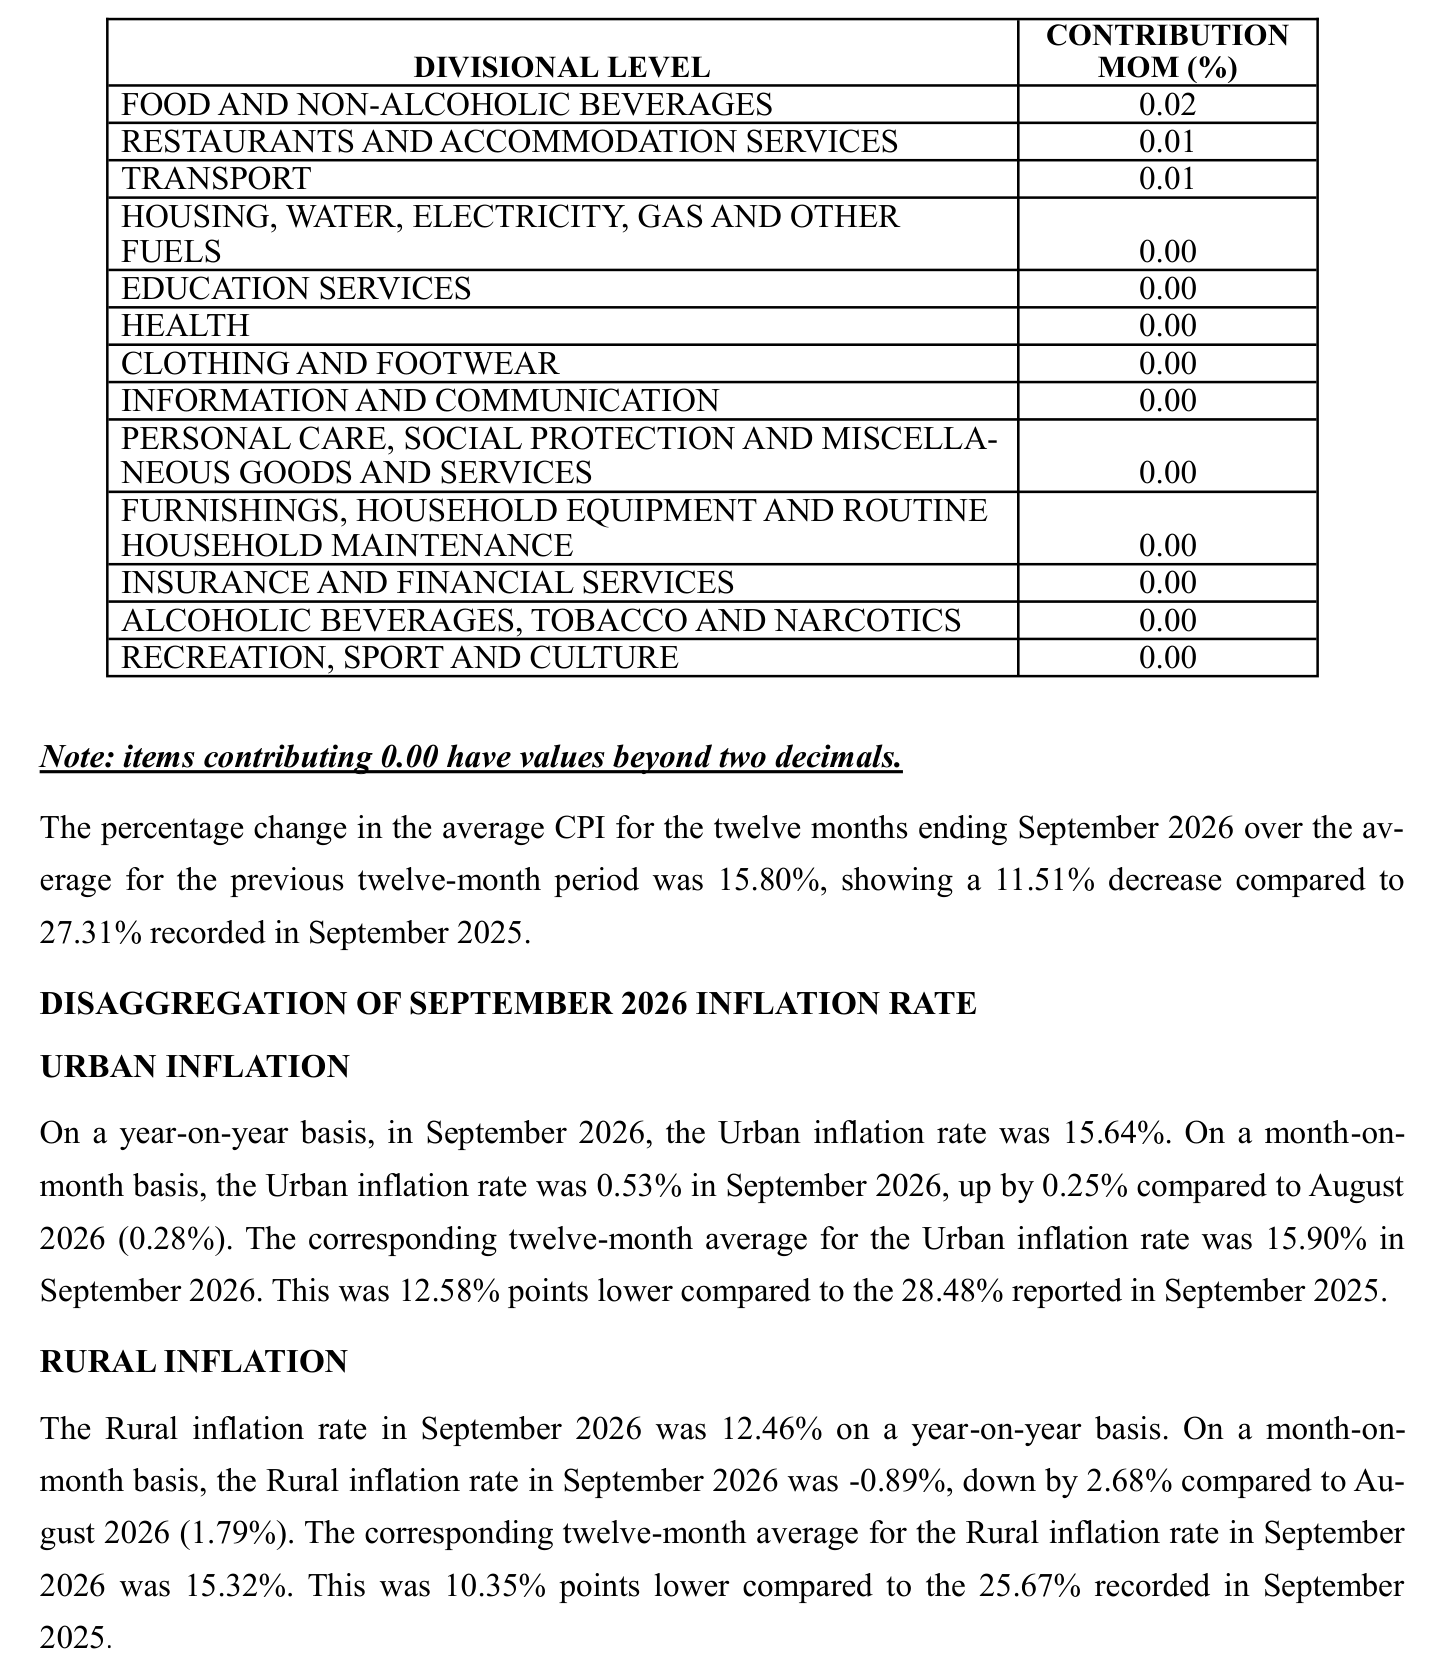
The report presents two contribution tables. The one on page 6, headed "CONTRIBUTION YOY (%)", gives food and non-alcoholic beverages 5.85 points of the 14.63, restaurants and accommodation 1.89, transport 1.56, housing and utilities 1.23, and so on down to recreation at 0.05. Each of the 13 figures equals the headline rate multiplied by that division's weight in the basket. Food carries a weight of 40.02 per cent, and 14.63 x 0.4002 = 5.85; restaurants carry 12.92 per cent, and 14.63 x 0.1292 = 1.89; transport carries 10.66 per cent, and 14.63 x 0.1066 = 1.56. The month-on-month table on page 7 does the same with 0.06: 0.056 x 0.4002 = 0.02 for food, 0.01 for restaurants and transport, and 0.00 for the rest. Because the figures are the weights scaled to the total, the tables rank the divisions in the same order every month and cannot show any division pulling against the total. The report does not say how the column is calculated.
The workbook makes a direct check possible. Sheet "Table2" gives the index for each of the 13 divisions alongside its weight. Multiplying each division's index by its weight and dividing by 100 reproduces the all-items index to within 0.02 points in every one of the 21 months from January 2025 to September 2026; for September 2026 the weighted sum is 146.40 against a published 146.38. That means each division's share of a change in the all-items index can be read straight off the table: its weight, times the change in its own index, divided by the all-items index at the start of the period.
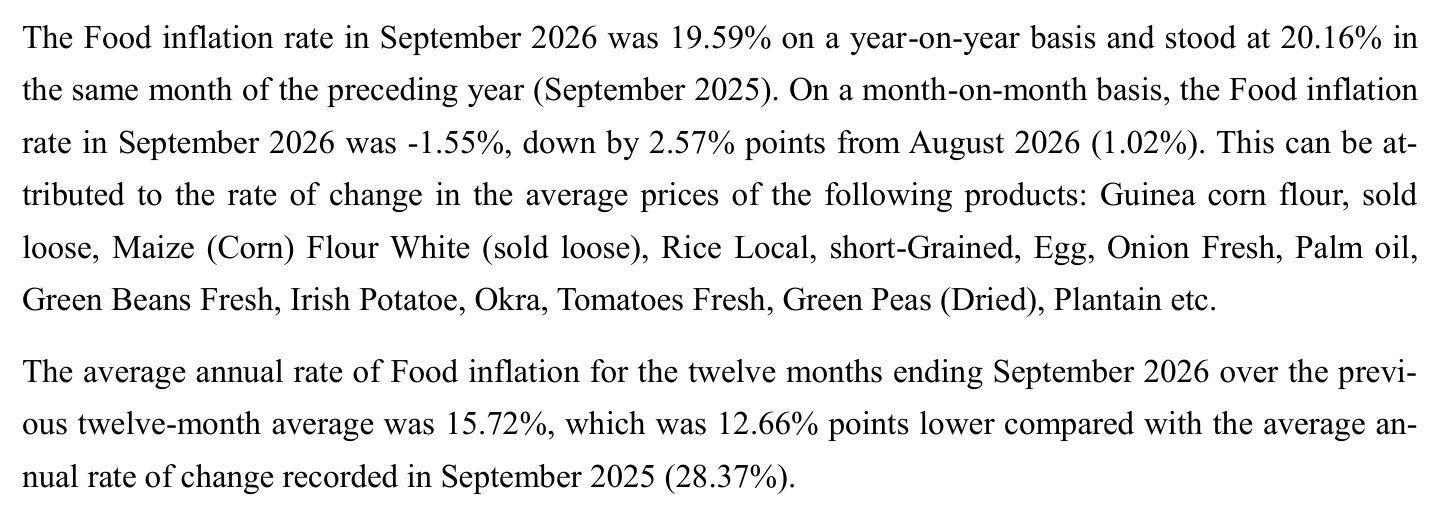
On that basis September looks different from the Bureau's table. Food subtracted about 0.38 points: 40.02 x (149.45 - 150.84) / 146.30. Transport, whose index rose 1.47 per cent, added 0.15 points; restaurants and accommodation, up 0.78 per cent, added 0.105; education, up 1.79 per cent, added 0.104; housing and utilities, up 0.62 per cent, added 0.05; personal care added 0.03. Clothing and furnishings each subtracted about 0.01. The divisions that rose add 0.46 points between them and those that fell subtract 0.40, which nets to the month's 0.06 (0.058 on the rounded figures shown). The report's own text agrees that food prices fell: on page 10 it puts month-on-month food inflation at minus 1.55 per cent, a figure that refers to its separate "Food" index, with a weight of 27.98, which fell from 154.68 to 152.28. Both food measures fell; only the contribution table has food adding to the month.
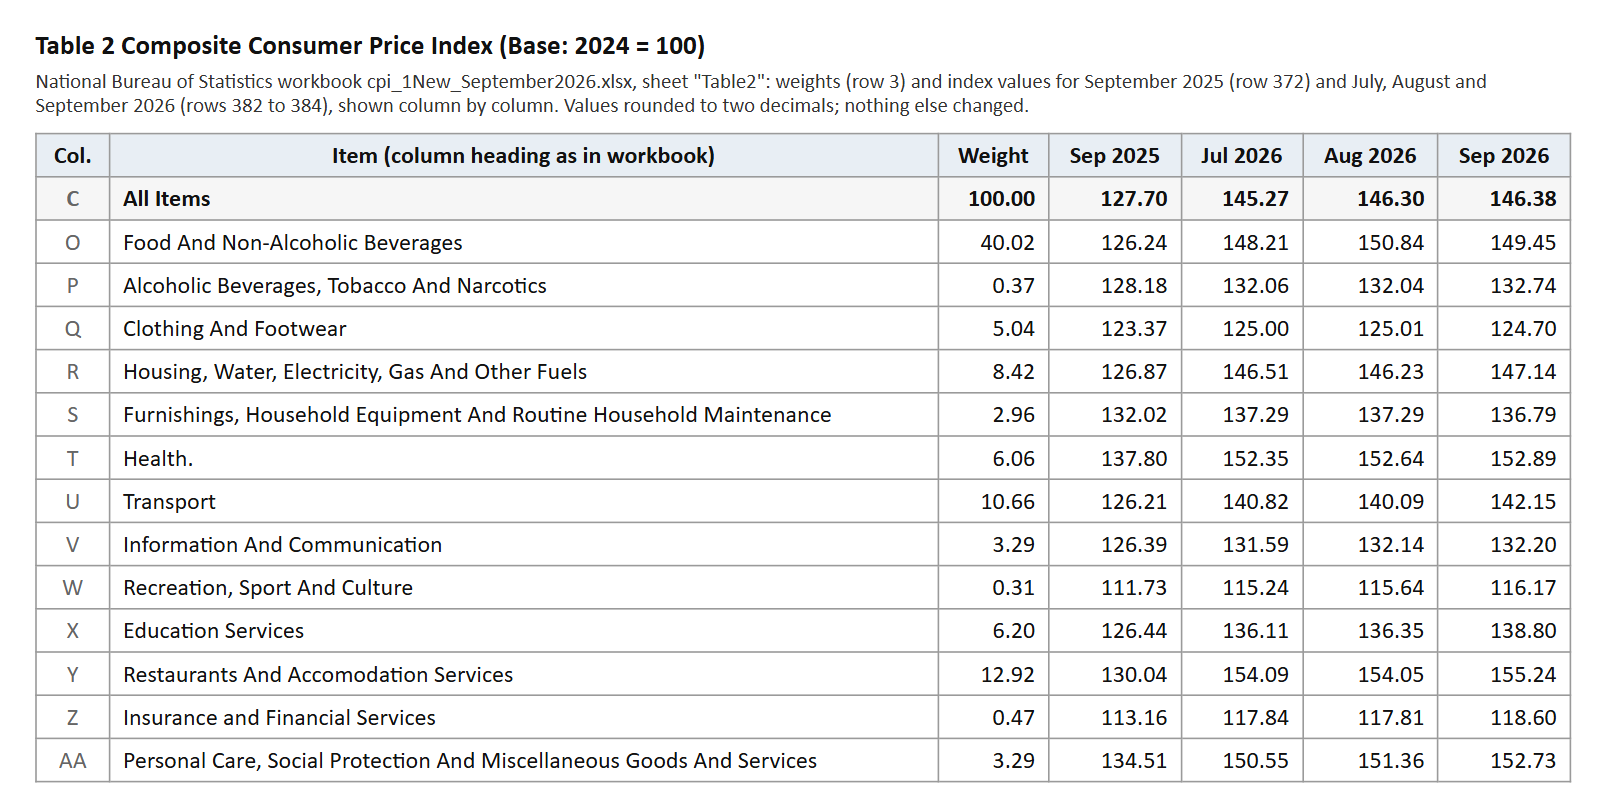
August shows the same gap in the other direction. The August report's table credited food with 0.28 points of that month's 0.71 per cent rise, again 0.71 x 0.4002. The workbook has the food division's index rising from 148.21 in July to 150.84 in August, an increase of 1.78 per cent, which on the same weights comes to about 0.72 points: in effect the whole of August's increase, with transport, down 0.52 per cent, taking about 0.05 points away. The August figures in the September workbook are unchanged from those in the August workbook.
Over the year the differences are smaller but still material. Set against September 2025, food accounts for about 7.27 of the 14.63 points, close to half of annual inflation, rather than the 5.85 points, or 40 per cent, in the table. Restaurants and accommodation account for 2.55 points rather than 1.89, and clothing and footwear, whose index rose 1.08 per cent in a year, for 0.05 points rather than the 0.74 the table shows. Food and restaurant meals together make up 9.82 of the 14.63 points, about two-thirds. The 13 recomputed contributions add to 14.63.
The rest of the report gives a mixed month. Food inflation was 19.59 per cent year on year, against 19.57 per cent in August. Core inflation, which leaves out farm produce and energy, fell to 12.95 per cent from 13.29 per cent, but on a monthly basis core prices rose 1.11 per cent after falling 0.06 per cent in August, and the energy index rose 5.38 per cent in the month. Urban inflation was 15.64 per cent year on year, down from 15.88 per cent, with prices up 0.53 per cent in the month; rural inflation fell to 12.46 per cent from 14.23 per cent, with prices down 0.89 per cent in the month. By state, the annual rate was highest in Imo (30.04 per cent), Enugu (22.38) and Niger (22.05) and lowest in Taraba (1.78), Bauchi (2.84) and Adamawa (3.66). Food inflation was highest in Lagos (34.40 per cent), Imo (33.79) and Ondo (31.49), and negative in Taraba (minus 7.47) and Yobe (minus 0.37). The Bureau itself warns that its state baskets carry different weights and that comparing states may mislead.
The figures bear out the World Bank's description in its October 2026 Nigeria Development Update, which said headline inflation was "plateauing at around 15.5 percent y/y between January and August 2026". The Bureau's eight monthly rates for those months run from 15.06 to 15.93 per cent and average 15.49 per cent. The Bank put food inflation at "an average of 20.0 percent in July and August"; the Bureau's rates for those months, 20.31 and 19.57 per cent, average 19.94 per cent, a small difference that does not change the Bank's point. On the Bureau's core measure the Bank's word "plateauing" fits less well: core moved from 17.72 per cent in January to 13.29 per cent in August, an average of 15.83 per cent, and the same report says elsewhere that core inflation "resumed its decline". September's 14.63 per cent is the lowest annual rate in the Bureau's workbook since October 2020, when the series shows 14.23 per cent.
Fitch Ratings, in the rating commentary it issued on 9 October, before the September figures, said it forecast "average annual inflation to moderate" to 15.4 per cent in 2026. The nine monthly rates published so far, January to September, average 15.39 per cent. For a simple average of the 12 monthly rates to reach 15.4 per cent, October to December would need to average about 15.43 per cent; if the rate stayed at September's 14.63 per cent for the rest of the year, the average would be about 15.20 per cent. Fitch does not say which average it uses, and on the Bureau's other measure, the change in the 12-month average index, inflation for the year to September was 15.80 per cent.
On 8 October the presidential spokesman, Bayo Onanuga, said in a statement reported by Daily Trust that "The Federal Government is also working on a comprehensive package of fiscal measures to bring inflation down to single digits sustainably in the near term." September's headline rate of 14.63 per cent and core rate of 12.95 per cent remain above that mark. By the time of writing on Thursday, Vero Record had not found a statement on the September figures from the presidency, the Central Bank or an opposition party that it could read in full. At least one report of the release, by Arbiterz, repeated the year-on-year table, describing food as "the main driver of inflation contributing 5.85% YoY". On the workbook food is indeed the largest contributor, but at about 7.27 points rather than 5.85.
The documents support the Bureau's headline, food, core, urban and rural rates; each figure checked against the workbook matches. Nothing in them suggests any figure was altered, and no wrongdoing is alleged. The finding is narrower: the report's contribution tables restate the basket weights scaled to the headline rate, so in September they show food adding to a month in which food prices fell, and in August they show food adding well under half of a rise that food accounted for almost entirely. The Bureau may define its contribution column differently, but the report does not say so, and Vero Record will report any explanation it gives.
What this rests on
Two releases of the National Bureau of Statistics, each a zip file holding a report and an Excel workbook, downloaded and read for this report on 15 October 2026: the September 2026 CPI report (CPI_SEPTEMBER_2026.pdf, 21 pages) and workbook (cpi_1New_September2026.xlsx), from microdata catalogue 154, download 1440, fetched through an Internet Archive capture of 15 October 2026 because the Bureau's servers did not answer direct requests; and the August 2026 report (CPI_AUGUST_2026_final_.pdf) and workbook (cpi_1New_August2026_.xlsx), download 1435. Also the World Bank's Nigeria Development Update, October 2026 (pages 10 and 21 of the PDF) and Fitch Ratings' rating action commentary of 9 October 2026, copies already on file, with the relevant passages re-read for this report. Headline: all-items index 146.382021 (September 2026) / 127.70 (September 2025) = 1.14630, 14.63 per cent; 146.382021 / 146.30 = 1.00056, 0.06 per cent. Base effect: 1.153908 x 1.000561 / 1.007205 = 1.14630. Fall in annual rate: 15.39 - 14.63 = 0.76 points. Contribution tables equal rate x weight: year on year, 14.6296 x 0.4002 = 5.85 (food), x 0.1292 = 1.89 (restaurants), x 0.1066 = 1.56 (transport), x 0.0842 = 1.23 (housing), x 0.0620 = 0.91 (education), x 0.0606 = 0.89 (health), x 0.0504 = 0.74 (clothing), x 0.0329 = 0.48 (information and communication), x 0.0329 = 0.48 (personal care), x 0.0296 = 0.43 (furnishings), x 0.0047 = 0.07 (insurance), x 0.0037 = 0.05 (alcohol and tobacco), x 0.0031 = 0.05 (recreation); all 13 match page 6 and add to 14.63. Month on month, 0.0561 x 0.4002 = 0.022 (0.02), x 0.1292 = 0.007 (0.01), x 0.1066 = 0.006 (0.01), x 0.0842 = 0.005 (shown 0.00); matches page 7. August: 15.39 x 0.4002 = 6.16 and 0.71 x 0.4002 = 0.28, matching the August report's tables. Additivity: the 13 division weights in Table2 row 3 add to 100.01; the weighted sum of division indices divided by 100 differs from the all-items index by between 0.008 and 0.017 points in each month from January 2025 to September 2026 (September 2026: 146.398 against 146.382). September month-on-month contributions, weight x (September index - August index) / 146.30: food 40.02 x (149.45 - 150.84) = -55.63, -0.380; transport 10.66 x 2.06 = 21.96, +0.150; restaurants 12.92 x 1.19 = 15.37, +0.105; education 6.20 x 2.45 = 15.19, +0.104; housing 8.42 x 0.91 = 7.66, +0.052; personal care 3.29 x 1.37 = 4.51, +0.031; health 6.06 x 0.25 = 1.52, +0.010; clothing 5.04 x -0.31 = -1.56, -0.011; furnishings 2.96 x -0.50 = -1.48, -0.010; alcohol 0.37 x 0.70 = 0.26, +0.002; information 3.29 x 0.06 = 0.20, +0.001; recreation 0.31 x 0.53 = 0.16, +0.001; insurance 0.47 x 0.79 = 0.37, +0.003. Rises: 0.150 + 0.105 + 0.104 + 0.052 + 0.031 + 0.010 + 0.002 + 0.001 + 0.001 + 0.003 = 0.459; falls: 0.380 + 0.011 + 0.010 = 0.401; net 0.058 (published 0.056; difference is rounding). Food division change 149.45 / 150.84 - 1 = -0.92 per cent; transport 142.15 / 140.09 - 1 = +1.47; restaurants 155.24 / 154.05 - 1 = +0.77 on rounded figures (0.78 unrounded); education 138.80 / 136.35 - 1 = +1.80 on rounded figures (1.79 unrounded); housing 147.14 / 146.23 - 1 = +0.62. Food index (weight 27.98): 152.28 / 154.68 - 1 = -1.55 per cent. August: food 40.02 x (150.84 - 148.21) / 145.27 = 105.25 / 145.27 = 0.72; food division change 150.84 / 148.21 - 1 = +1.78 per cent; transport 10.66 x (140.09 - 140.82) / 145.27 = -0.05. Year on year, weight x (September 2026 - September 2025) / 127.70: food 40.02 x 23.21 = 928.86, 7.274; alcohol 0.37 x 4.56, 0.013; clothing 5.04 x 1.33, 0.052; housing 8.42 x 20.27, 1.337; furnishings 2.96 x 4.77, 0.111; health 6.06 x 15.09, 0.716; transport 10.66 x 15.94, 1.331; information 3.29 x 5.81, 0.150; recreation 0.31 x 4.44, 0.011; education 6.20 x 12.36, 0.600; restaurants 12.92 x 25.20, 2.550; insurance 0.47 x 5.44, 0.020; personal care 3.29 x 18.22, 0.469. Total 14.634. Food share 7.27 / 14.63 = 49.7 per cent; food plus restaurants 7.27 + 2.55 = 9.82, 67 per cent. Clothing index change 124.70 / 123.37 - 1 = 1.08 per cent. World Bank comparison: January to August 2026 headline rates 15.10 + 15.06 + 15.38 + 15.69 + 15.93 + 15.91 + 15.43 + 15.39 = 123.89, / 8 = 15.49. Food July and August (20.31 + 19.57) / 2 = 19.94. Core January to August 17.72 + 15.88 + 16.21 + 15.86 + 16.82 + 15.92 + 14.97 + 13.29 = 126.67, / 8 = 15.83. Lowest since: the workbook's annual rate was last at or below 14.63 per cent in October 2020 (14.23). Fitch comparison: January to September 123.89 + 14.63 = 138.52, / 9 = 15.39. For a 12-month mean of 15.4: 15.4 x 12 = 184.80; 184.80 - 138.52 = 46.28; / 3 = 15.43. If October to December stayed at 14.63: (138.52 + 43.89) / 12 = 182.41 / 12 = 15.20. Change from August: food inflation 19.59 - 19.57 = +0.02 points; core 13.29 - 12.95 = 0.34 points lower; urban 15.88 - 15.64 = 0.24 points lower; rural 14.23 - 12.46 = 1.77 points lower. State spread 30.04 - 1.78 = 28.26 points.
What this does not establish
How the Bureau calculates its contribution column; the report does not say, and the identity between every figure and the headline rate times the division weight is our observation, checked for September and August 2026 only. Whether earlier monthly reports used the same method was not checked. Why prices of individual food items fell in September; the report names items such as guinea corn flour, maize flour, local rice, eggs, onions, palm oil and tomatoes but gives no reasons, and no seasonal adjustment is applied in the figures used here. Which average Fitch's 15.4 per cent forecast refers to, and whether the World Bank used the Bureau's published rates or its own calculations for its 20.0 per cent food figure. Whether the Bureau's other aggregates (goods and services, farm produce, energy and core) add up in the same way as the 13 divisions; on a rough check they do not combine into the all-items index with the printed weights, so this report uses only the divisions. The state rates were not checked against the state tables. No same-day statement on the September figures from the presidency, the Central Bank or an opposition party was found and read. Nothing in the documents suggests any figure was altered, and no wrongdoing is alleged.
What we did ourselves
Retrieved the September 2026 CPI release (report and workbook) through an Internet Archive capture when the Bureau's servers did not respond, and set the report's two divisional contribution tables against the 13 division indices and weights in the workbook. Showed that every figure in both tables, for September and August 2026, equals the headline rate multiplied by the division's weight. Verified that the weighted division indices reproduce the all-items index in each of the 21 months from January 2025, then recomputed each division's month-on-month and year-on-year contribution, which reverses the sign of food's September contribution. Recomputed the headline, the base effect and the averages behind the World Bank's October 2026 description and Fitch's 9 October forecast.
Sources for this report
(A) National Bureau of Statistics, Consumer Price Index September 2026 (Base Period 2024 = 100), pages 6, 7, 10, 12, 13 and 16, and workbook cpi_1New_September2026.xlsx, sheets Table1 and Table2; with the Bureau's August 2026 report and workbook.
- September 2026 CPI Report (CPI_SEPTEMBER_2026.zip: report, 21 pages, and workbook cpi_1New_September2026.xlsx) · National Bureau of Statistics · 15 October 2026
- Internet Archive capture of the September 2026 CPI download · Internet Archive · 15 October 2026
- Consumer Price Index catalogue, related materials · National Bureau of Statistics · accessed 15 October 2026
- August 2026 CPI Report (report and workbook) · National Bureau of Statistics · 15 September 2026
- Nigeria Development Update, October 2026: Beyond the Federal Purse, How Higher Revenues Shaped State Priorities · World Bank · October 2026
- Fitch Revises Nigeria's Outlook to Positive; Affirms at 'B' (rating action commentary) · Fitch Ratings · 9 October 2026
- FG working to bring down inflation, says Presidency · Daily Trust · 8 October 2026
- FG working to bring down inflation, says Presidency (republished with full statement text) · Parrot Nigeria · 8 October 2026
- Breaking: Nigeria's Headline Inflation Eases Further to 14.63% in September · Arbiterz · 15 October 2026
- Bodija market, Ibadan (photograph) · Wikimedia Commons (Afolly, CC BY-SA 4.0) · 24 December 2016
Confidence: high. This is our own assessment of whether the event occurred as described, separate from the grade, which describes what kind of thing the claim rests on.
Not obtained: where the underlying document is named above but not linked, we did not hold a copy at the time of publication. We purchase nothing and request nothing in our own name.
Corrections
None on this report. If you find an error, it will be published here, at the same length, with the date it was found, and the original wording will remain visible above it.

Dr VeroInvestigations editor, Vero Record
Reads the Nigerian public record that others leave unread: budgets, audit reports, court files and registers. Every claim on this page carries the grade of the document behind it, and the report says what that document does not establish.
All 118 reportsHow we grade evidenceAdd Vero Record as a preferred source on Google