
States' foreign debt grew 42% in a year, and the March table didn't show it
The Debt Management Office's June 30, 2026 table puts Nigeria's public debt at N166,788,480.19 million, and its parts add up. In dollars, the external debt owed by the states and the FCT went from US$4,811.92 million to US$6,832.80 million in twelve months. The March 2026 table, published in between, does not split external debt by who owes it.
The Debt Management Office has published its one-page table of Nigeria's total public debt as at June 30, 2026. The newspapers reported the headline figure as N166.79 trillion. The table itself puts the total at N166,788,480.19 million, or US$120,932.71 million. Vero Record downloaded the PDF from the DMO website, along with the tables for March 31, 2026, December 31, 2025 and June 30, 2025, and re-added each one.
The June 2026 table adds up. Total external debt of N75,198,046.27 million is the sum of N65,774,356.36 million owed by the federal government and N9,423,689.91 million owed by the states and the Federal Capital Territory. Total domestic debt of N91,590,433.92 million is the sum of N86,999,153.24 million federal and N4,591,280.68 million state. The two totals together give N166,788,480.19 million. The dollar columns also add to the stated US$120,932.71 million. In our addition, the federal government's share comes to N152,773,509.60 million and the sub-national share to N14,014,970.59 million. These match the N152.77 trillion and N14.01 trillion that BusinessDay, Leadership and other outlets reported.
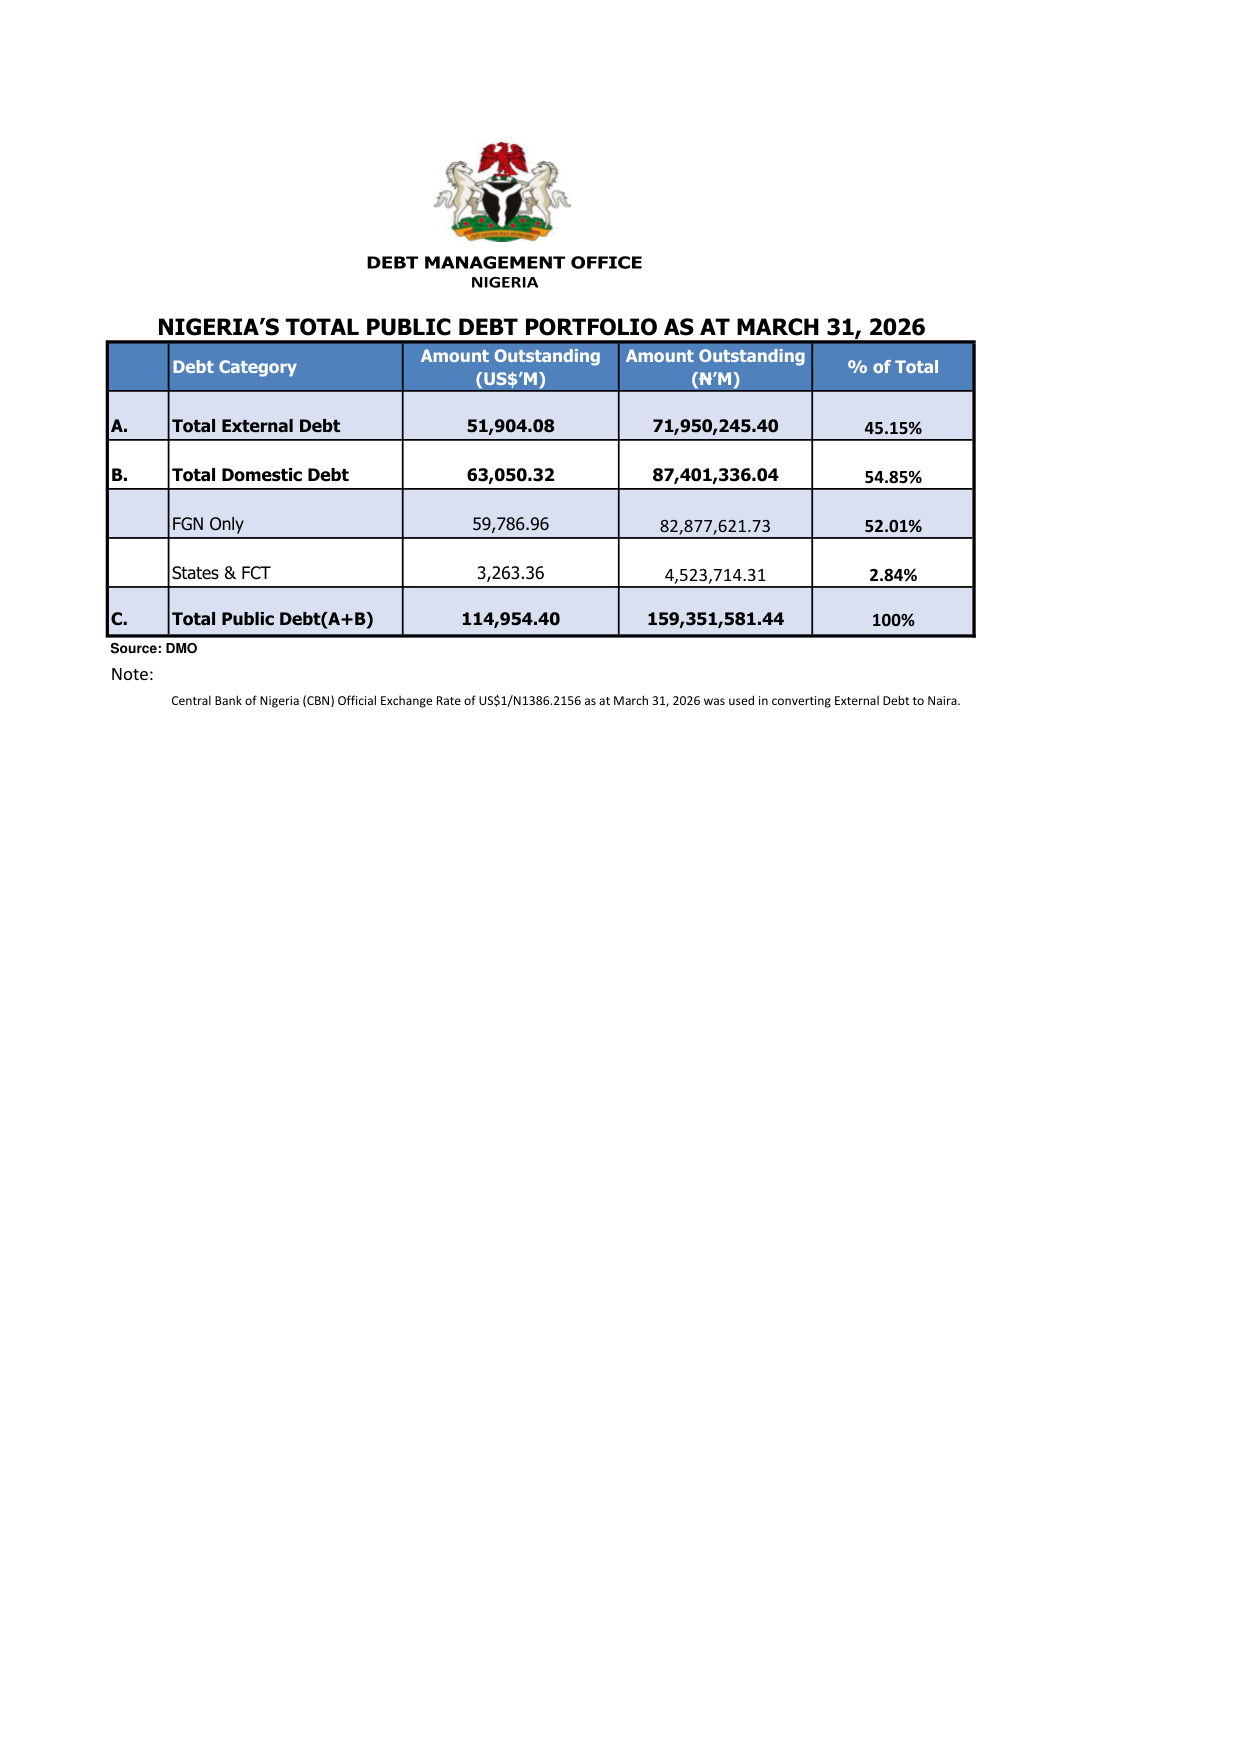
The press coverage centred on two comparisons, and both hold against the DMO's own tables. From March 31, 2026, when the table showed N159,351,581.44 million, the stock rose by N7,436,898.75 million in three months. From June 30, 2025, when it showed N152,398,613.10 million, it rose by N14,389,867.09 million in a year. Both differences are our arithmetic on the DMO figures.
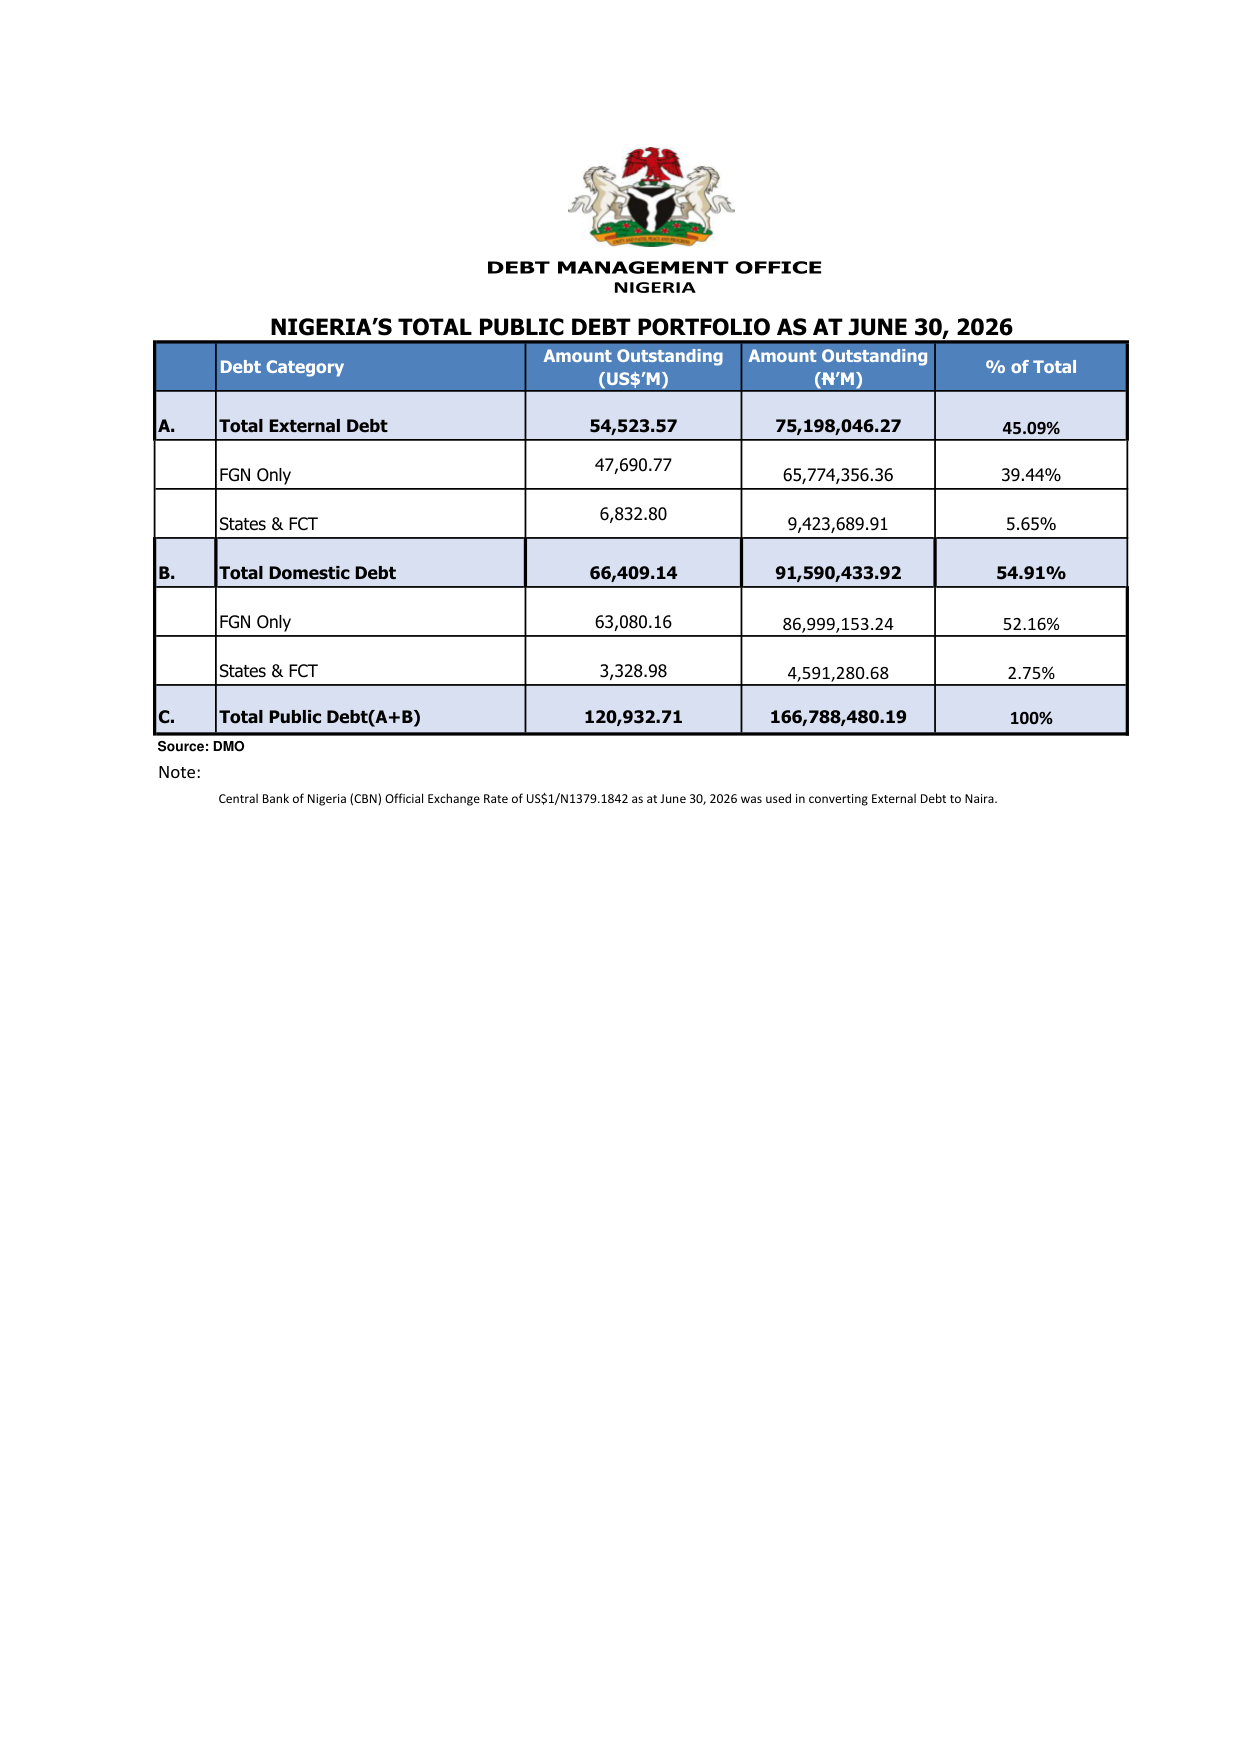
The yearly comparison hides how much of the rise came from each side. Measured in naira, domestic debt went up by N11,039,405.89 million over the year, from N80,551,028.03 million to N91,590,433.92 million. That is about 77 percent of the total increase. External debt went up by only N3,350,461.20 million in naira. In dollars it went up by US$7,540.12 million, from US$46,983.45 million to US$54,523.57 million.
The gap comes from the exchange rate. The June 2025 table converted external debt at the Central Bank's official rate of US$1/N1529.2105. The June 2026 table used US$1/N1379.1842. If June 2026's US$54,523.57 million of external debt is converted at the June 2025 rate, it comes to about N83.38 trillion rather than N75.20 trillion. That calculation is ours, not the DMO's. It shows that a stronger naira kept roughly N8.18 trillion of foreign debt out of the naira headline.
The biggest proportional change in the four tables is in a smaller line: the external debt of the 36 states and the FCT. On June 30, 2025 it stood at US$4,811.92 million. On December 31, 2025 it was US$5,684.92 million. On June 30, 2026 it was US$6,832.80 million. That is a rise of US$2,020.88 million in twelve months, about 42 percent by our calculation. About US$1,147.88 million of it came in the first half of 2026. The federal government's external debt rose by US$5,519.24 million over the same year, from US$42,171.53 million to US$47,690.77 million, which is roughly 13 percent.
The table for March 31, 2026, the quarter in between, gives no split of external debt by debtor. The December 2025, June 2025 and June 2026 tables each list external debt in two rows, 'FGN Only' and 'States & FCT'. The March 2026 PDF on the DMO website shows only 'Total External Debt' of US$51,904.08 million, or N71,950,245.40 million. It does still split domestic debt between the federal government and the states. As published, that table does not show how the first-quarter rise in states' foreign debt compared with the second quarter's. The document gives no reason for the omission.
The DMO tables do not say what the states borrowed or from whom. The DMO publishes separate state-by-state external debt tables, which were not part of this review. Vero Record has not checked the lenders behind the increase, so this article does not attribute it to any particular state, lender or loan.
The naira total alone can mislead in the other direction too. Vero Record reported on September 7 that between December 31, 2025 and March 31, 2026 the headline moved by only N75,512.26 million in naira but by US$3,980.51 million in dollars, because the rate used went from US$1/N1435.2571 to US$1/N1386.2156.
The June 2025 table carries a note that the domestic debt of Rivers State was reported as at December 31, 2024, not June 30, 2025. The December 2025 table notes that states' domestic figures come from their signed-off submissions. The June 2026 table carries only the exchange-rate note. It does not say whether every state's figures are current to June 30, 2026.
Vero Record set out to compare the debt stock with debt service and federal revenue, using the official releases. The DMO debt tables contain no debt-service figures. The quarterly budget implementation data that would give debt service and revenue for the first half of 2026 was not reviewed for this article, so no ratio of debt service to revenue is given here.
The documents behind this article are the four DMO PDFs, downloaded from dmo.gov.ng on September 29, 2026. Every figure quoted from them is copied as printed, in millions. All differences, percentages and the conversion at the 2025 exchange rate are Vero Record's own calculations and are labelled as such.
What this rests on
Four one-page DMO debt tables downloaded and read in this task (Grade A). Press figures of N166.79trn, N7.44trn and N14.39trn checked against them (B). All differences, percentages and the conversion at the 2025 rate are our arithmetic (C) and are marked as such in the text.
What this does not establish
Which states, lenders or loans account for the US$2,020.88m rise in sub-national external debt. Why the March 2026 table does not split external debt by debtor; the DMO has not been asked. Whether all states' domestic figures are current to June 30, 2026. The ratio of debt service to revenue for 2026, since budget implementation data was not reviewed.
What we did ourselves
Re-added all four DMO tables row by row. Compared FGN and States & FCT external debt in dollars across June 2025, December 2025 and June 2026. Found that the March 2026 table has no external debtor split. Isolated the exchange-rate effect by converting at the June 2025 rate.
Sources for this report
(A) Debt Management Office, 'Nigeria's Total Public Debt as at June 30, 2026' (PDF, dmo.gov.ng item 6080), compared with the DMO tables for March 31, 2026, December 31, 2025 and June 30, 2025.
- Nigeria's Total Public Debt as at June 30, 2026 · Debt Management Office · 2026-09
- Nigeria's Total Public Debt as at March 31, 2026 · Debt Management Office
- Nigeria's Total Public Debt as at December 31, 2025 · Debt Management Office
- Nigeria's Total Public Debt as at June 30, 2025 · Debt Management Office
- DMO Total Public Debt listing · Debt Management Office
- Nigeria's public debt rises by N14.39trn in one year to N166.79trn · BusinessDay
- Nigeria's Public Debt Hits N166.79trn In Q2 2026 - DMO · Leadership
Confidence: high. This is our own assessment of whether the event occurred as described, separate from the grade, which describes what kind of thing the claim rests on.
Not obtained: where the underlying document is named above but not linked, we did not hold a copy at the time of publication. We purchase nothing and request nothing in our own name.
Corrections
None on this report. If you find an error, it will be published here, at the same length, with the date it was found, and the original wording will remain visible above it.